 2
2peptides
spectra
0.000 | 0.000
0.010 | 0.145
0.000 | 0.000
0.000 | 0.000
0.041 | 0.154
0.000 | 0.000
0.774 | 0.846
0.000 | 0.000
2peptides
spectra
0.000 | 0.000
1.000 | 1.000
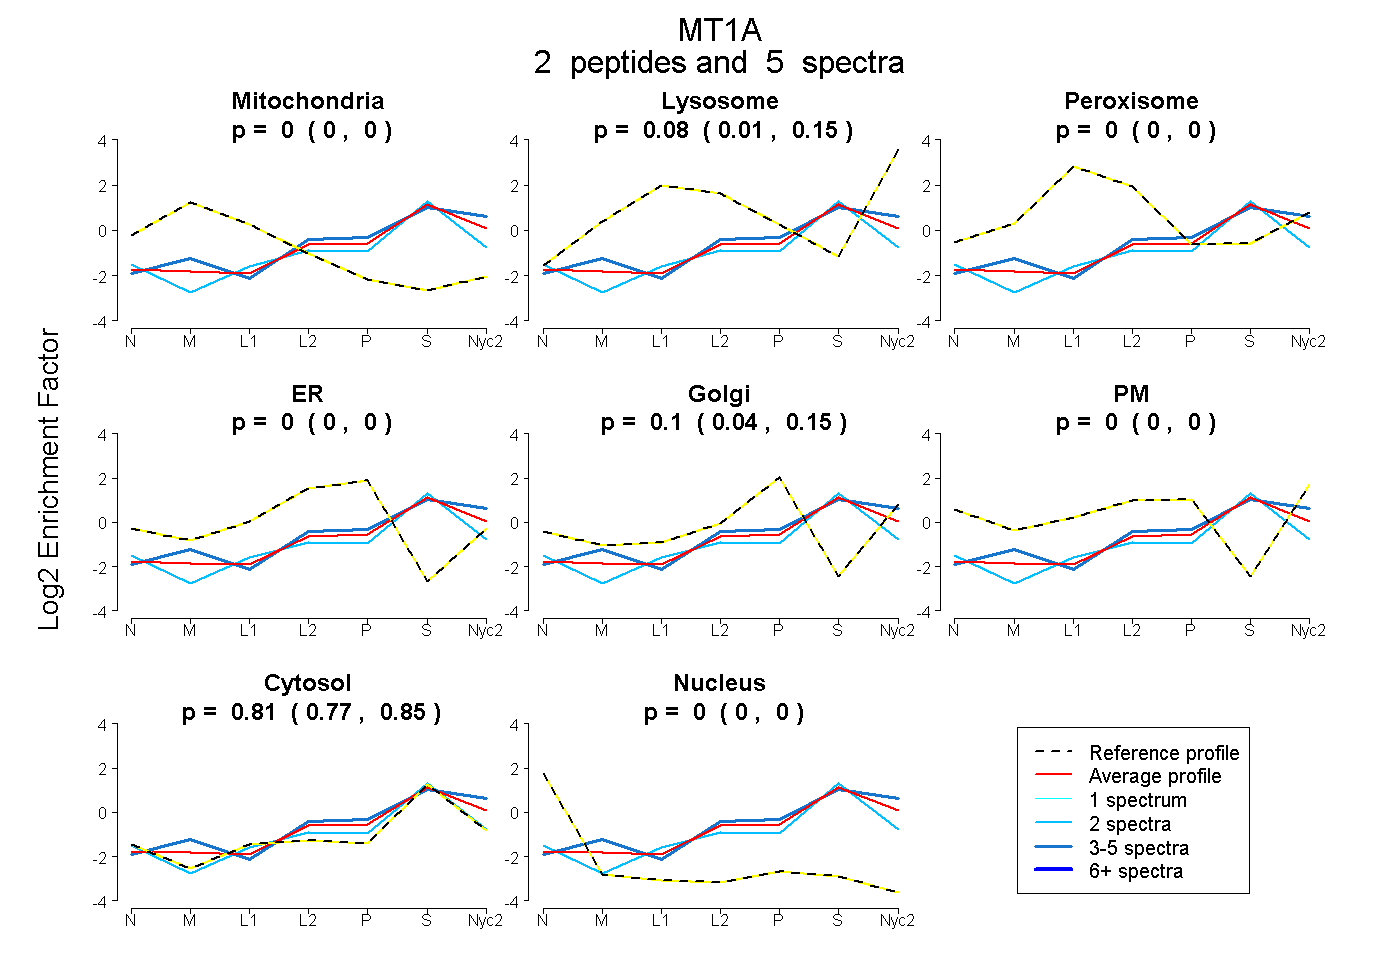
| Plot | Mito | Lyso | Perox | ER | Golgi | PM | Cytosol | Nucleus | |||||
| Expt A |
2 peptides |
5 spectra |
|
0.000 0.000 | 0.000 |
0.085 0.010 | 0.145 |
0.000 0.000 | 0.000 |
0.000 0.000 | 0.000 |
0.101 0.041 | 0.154 |
0.000 0.000 | 0.000 |
0.814 0.774 | 0.846 |
0.000 0.000 | 0.000 |
||
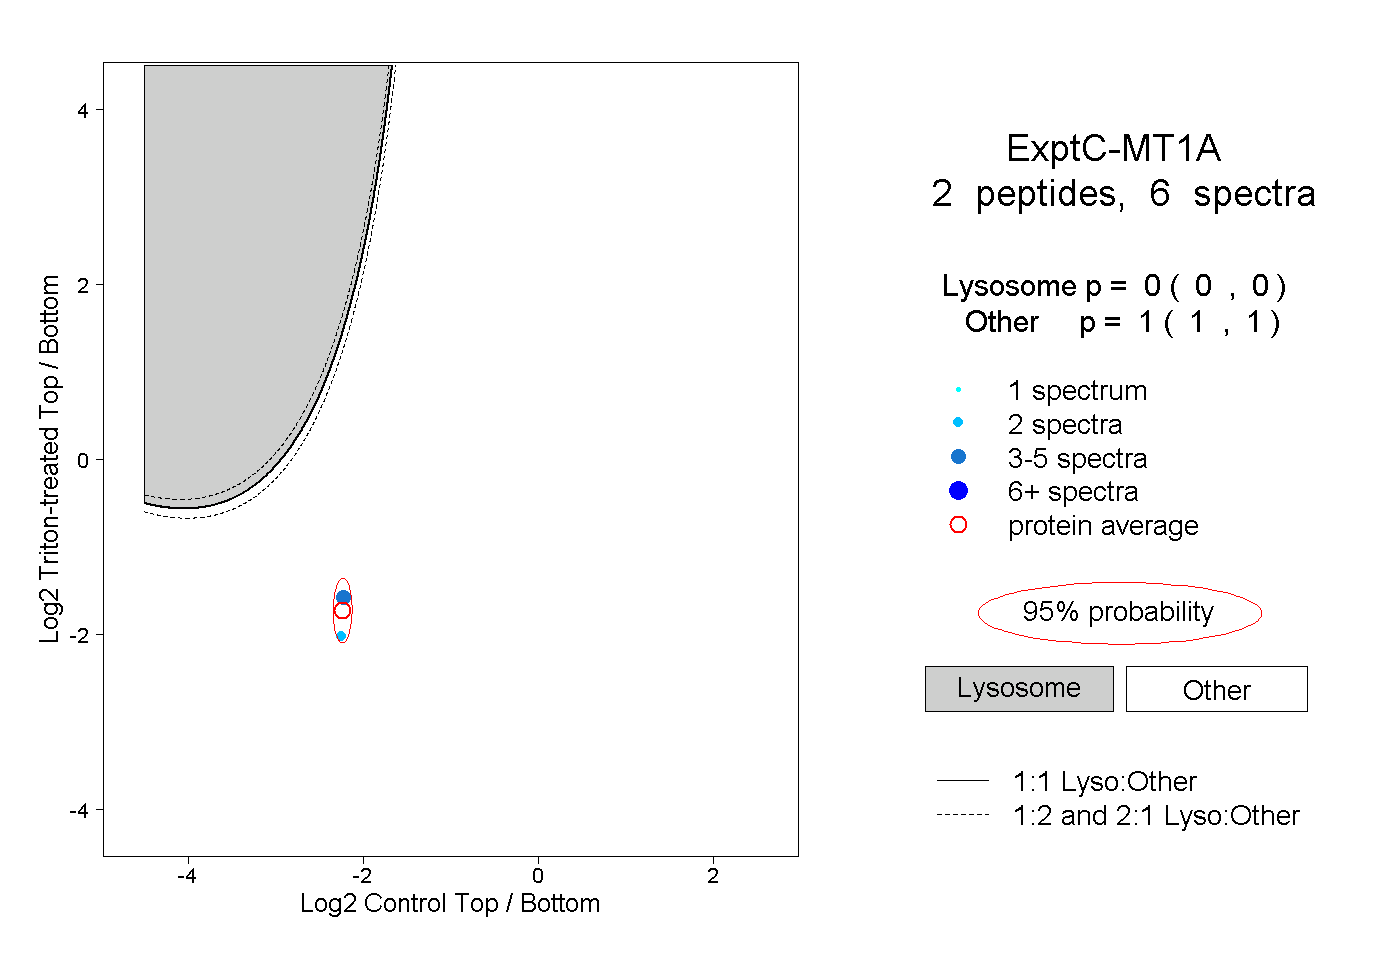
| Plot | Lyso | Other | |||||||||||
| Expt C |
2 peptides |
6 spectra |
|
0.000 0.000 | 0.000 |
1.000 1.000 | 1.000 |