13
13peptides
spectra
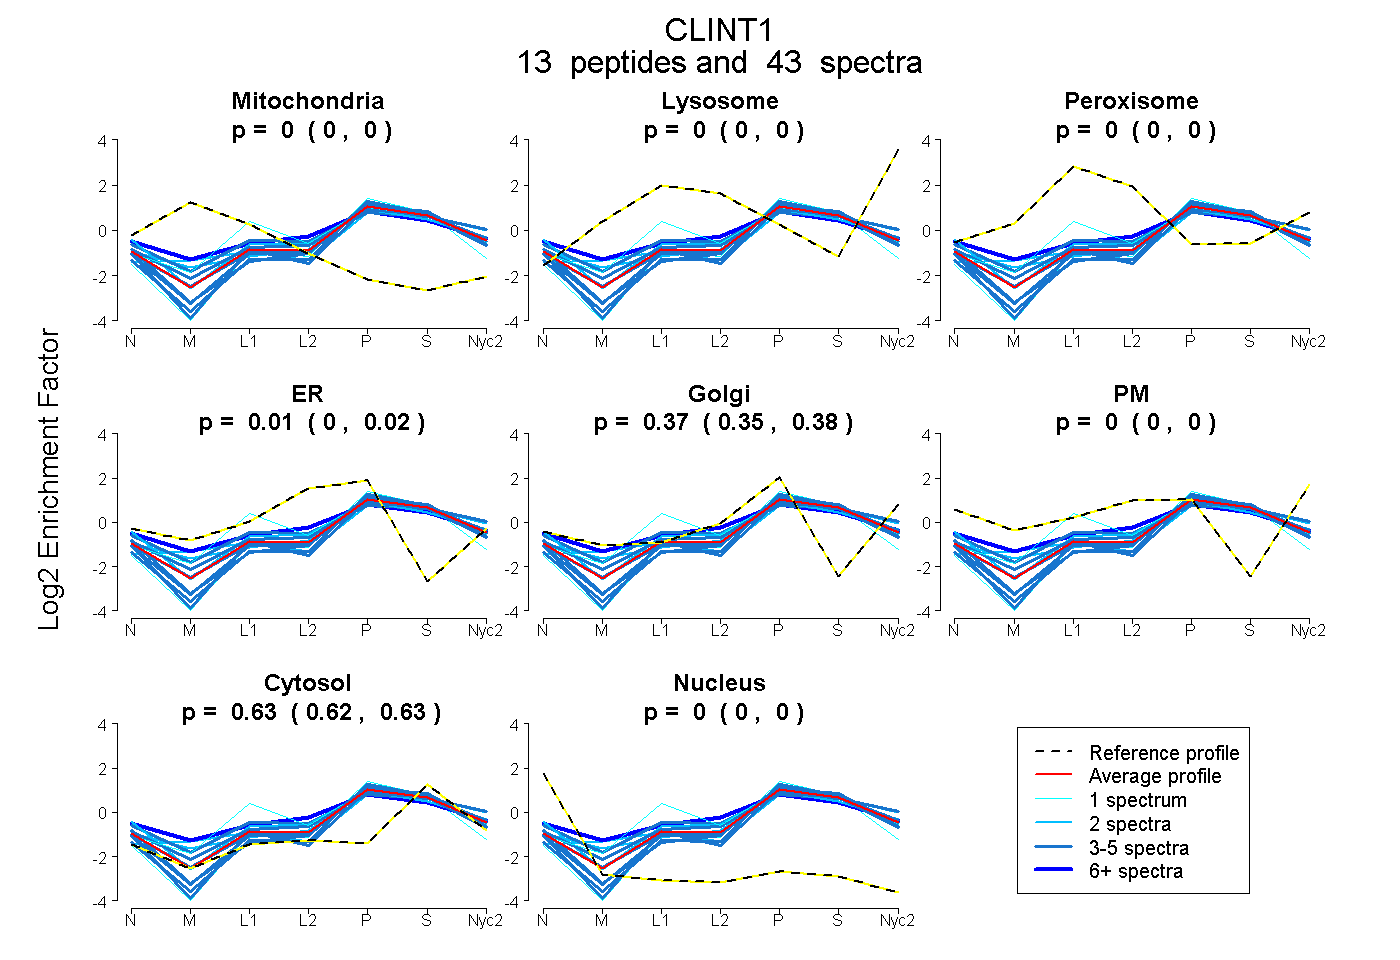
0.000 | 0.000
0.000 | 0.000
0.000 | 0.000
0.000 | 0.018
0.354 | 0.375
0.000 | 0.000
0.622 | 0.629
0.000 | 0.000
5peptides
spectra
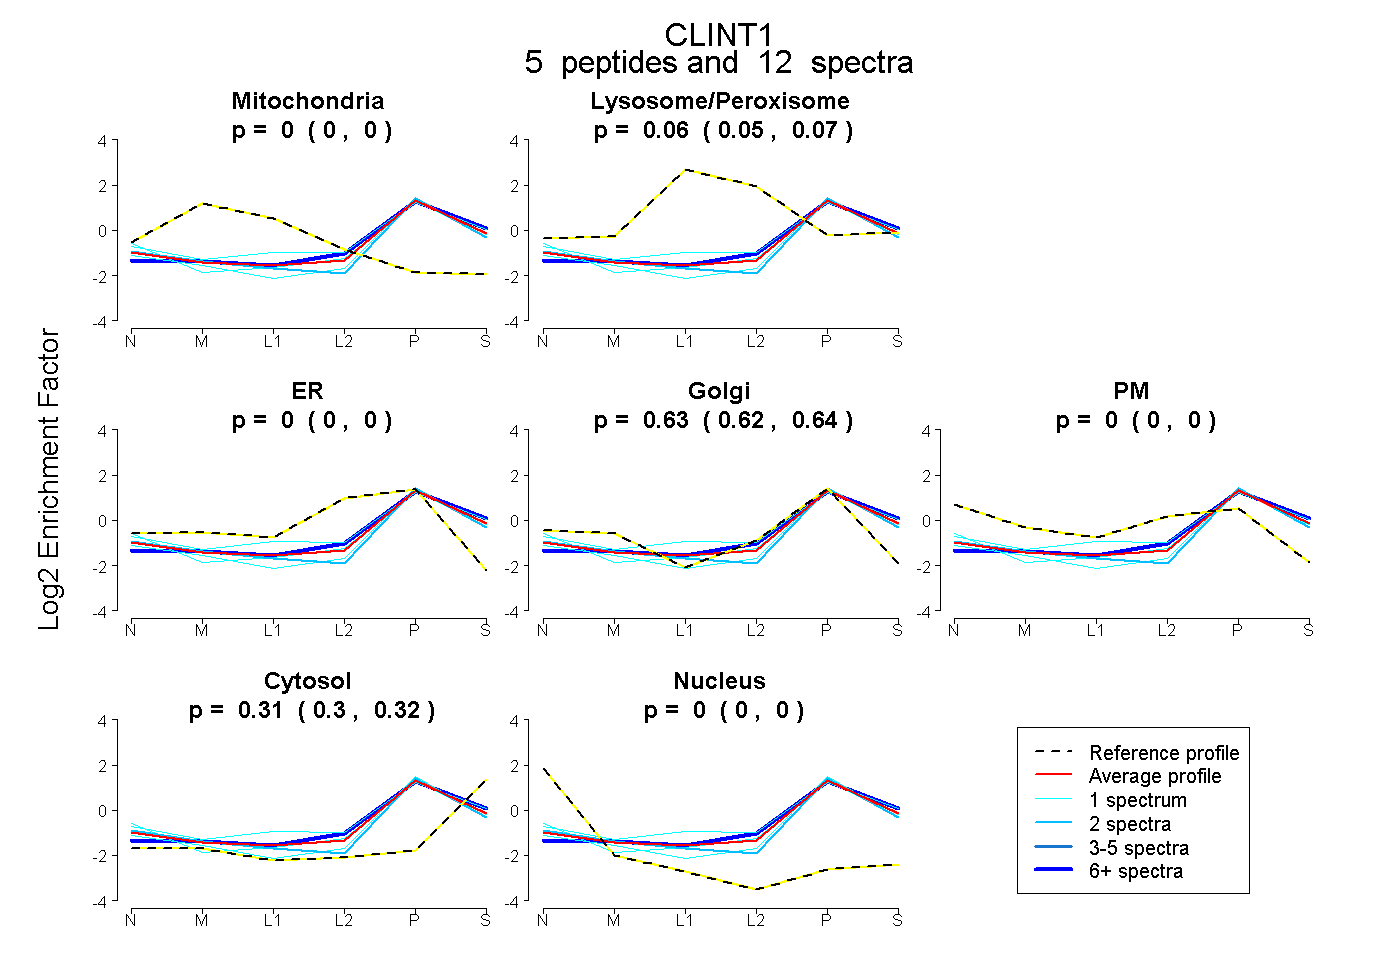
0.000 | 0.000
0.046 | 0.070
0.000 | 0.000
0.617 | 0.637
0.000 | 0.000
0.301 | 0.323
0.000 | 0.000
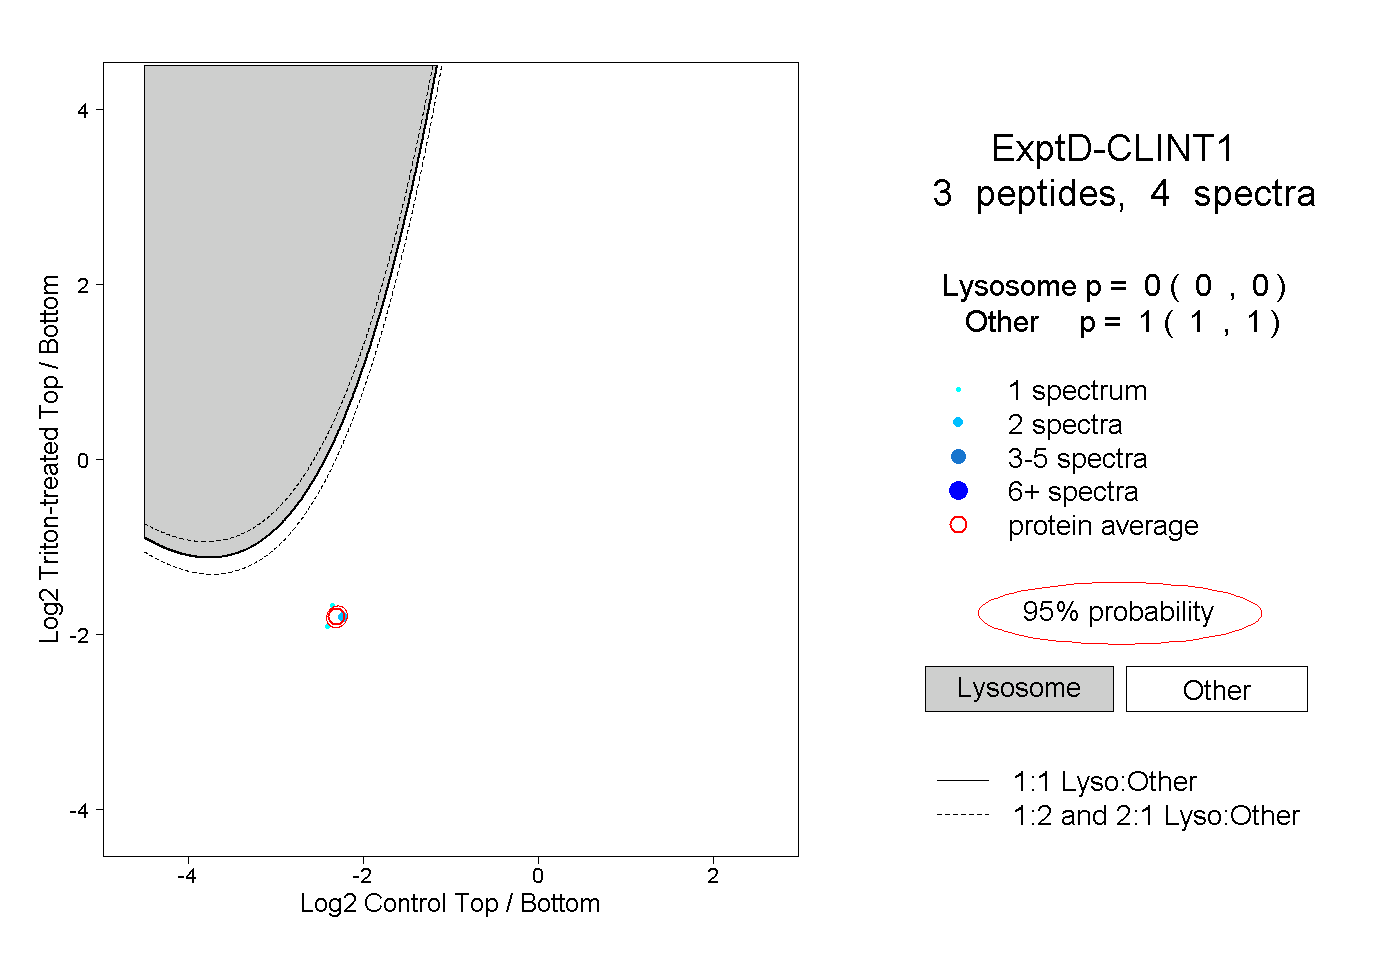
14peptides
spectra
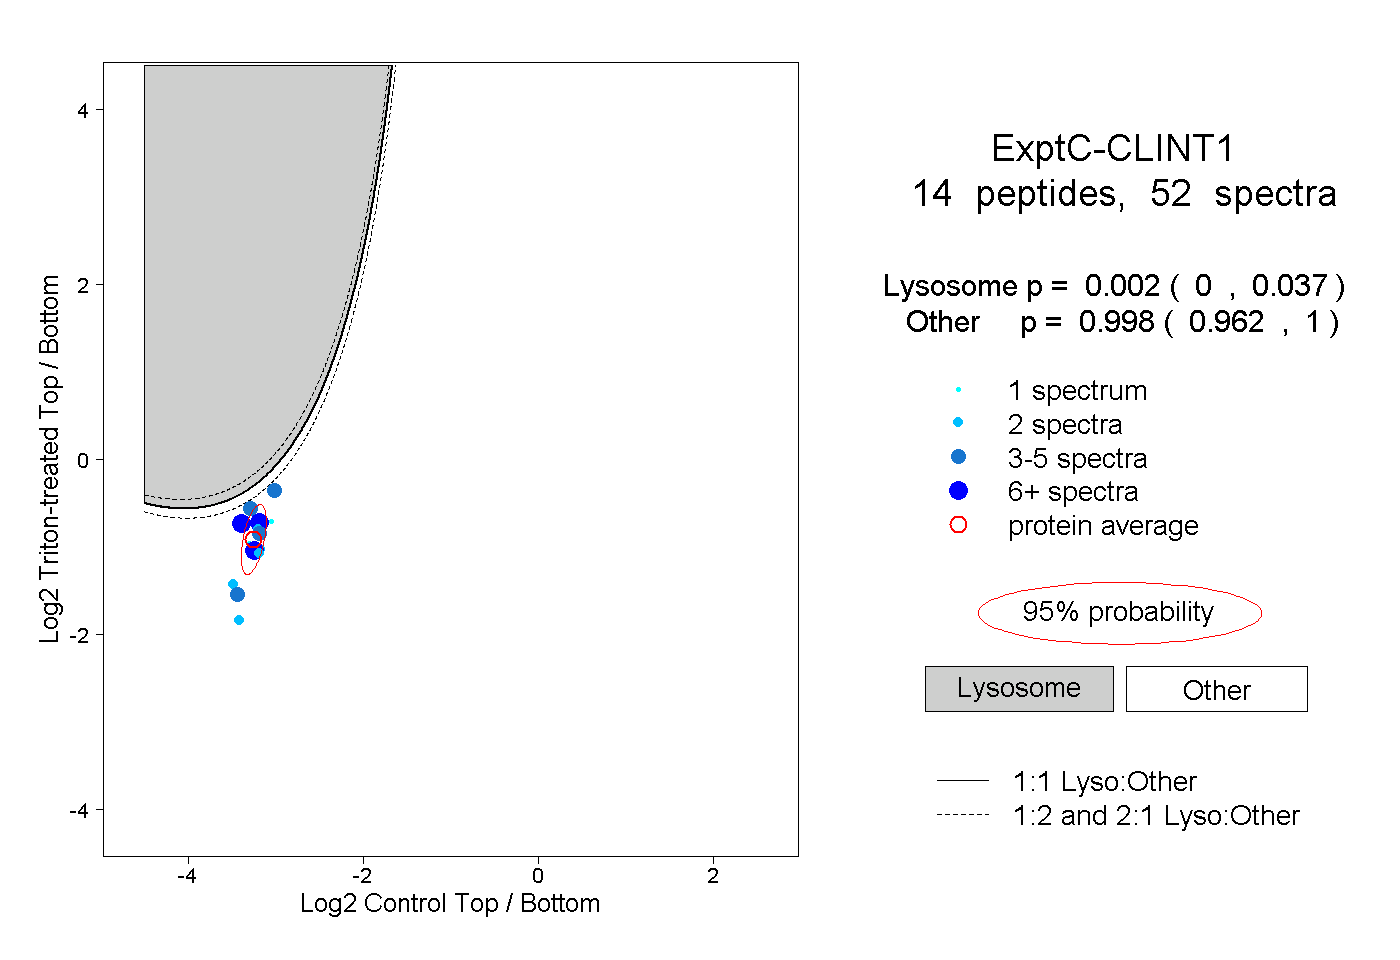
0.000 | 0.037
0.962 | 1.000