CLINT1
[ENSRNOP00000030596]
Main page
| | | Plot |
Mito |
Lyso |
|
Perox |
ER |
Golgi |
PM |
Cytosol |
Nucleus |
|
| Expt A |
 13
13
peptides |
43
spectra |
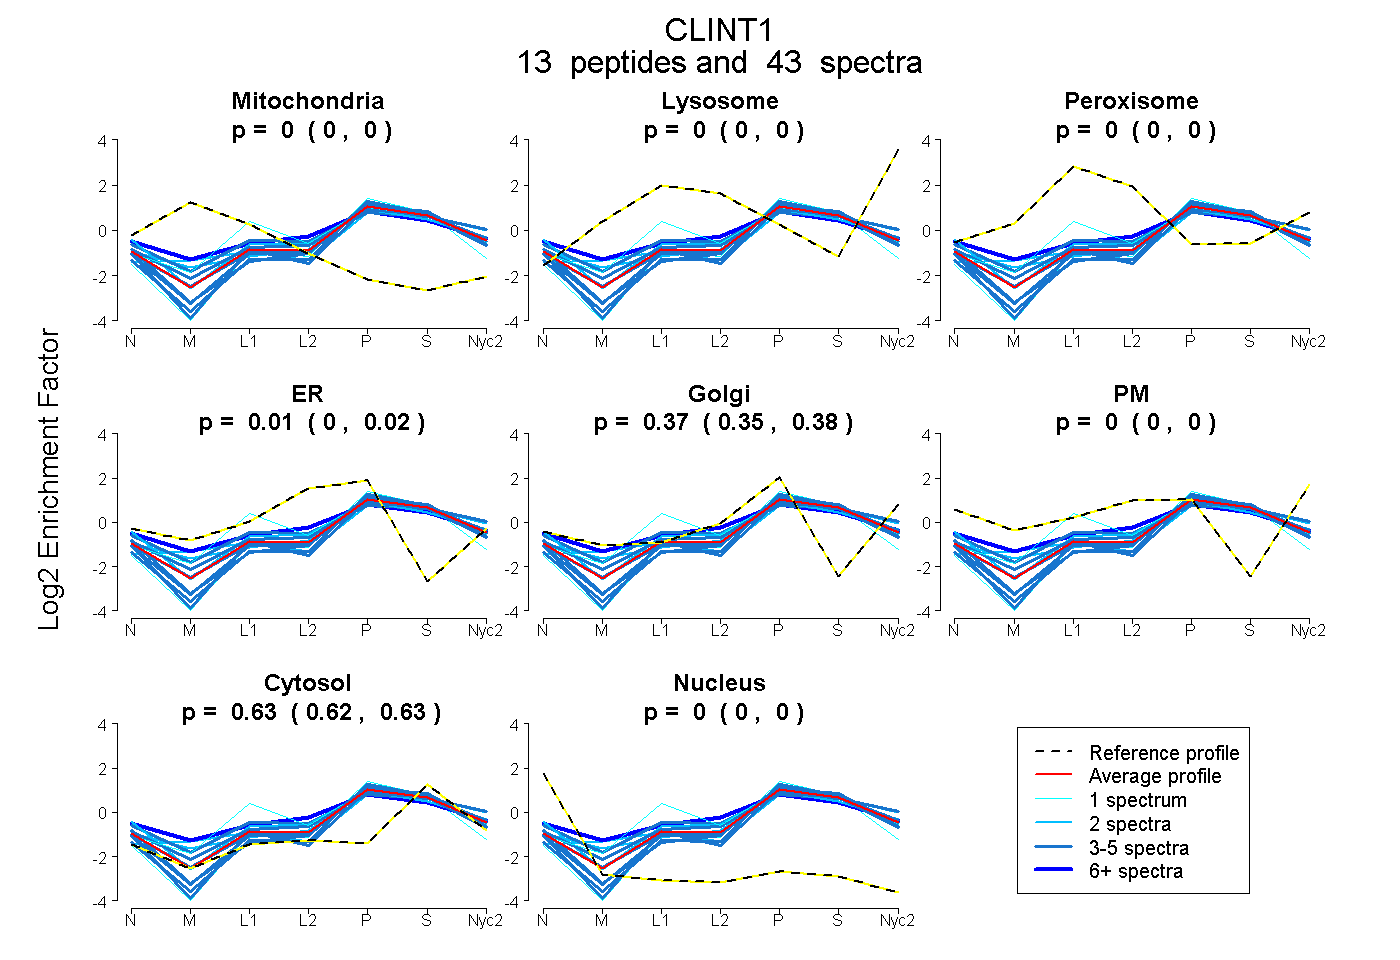 |
0.000
0.000 | 0.000 |
0.000
0.000 | 0.000 |
|
0.000
0.000 | 0.000 |
0.006
0.000 | 0.018 |
0.368
0.354 | 0.375 |
0.000
0.000 | 0.000 |
0.626
0.622 | 0.629 |
0.000
0.000 | 0.000 |
|
| | | Plot |
Mito |
|
Lyso or Perox |
|
ER |
Golgi |
PM |
Cytosol |
Nucleus |
|
| Expt B |
5
peptides |
12
spectra |
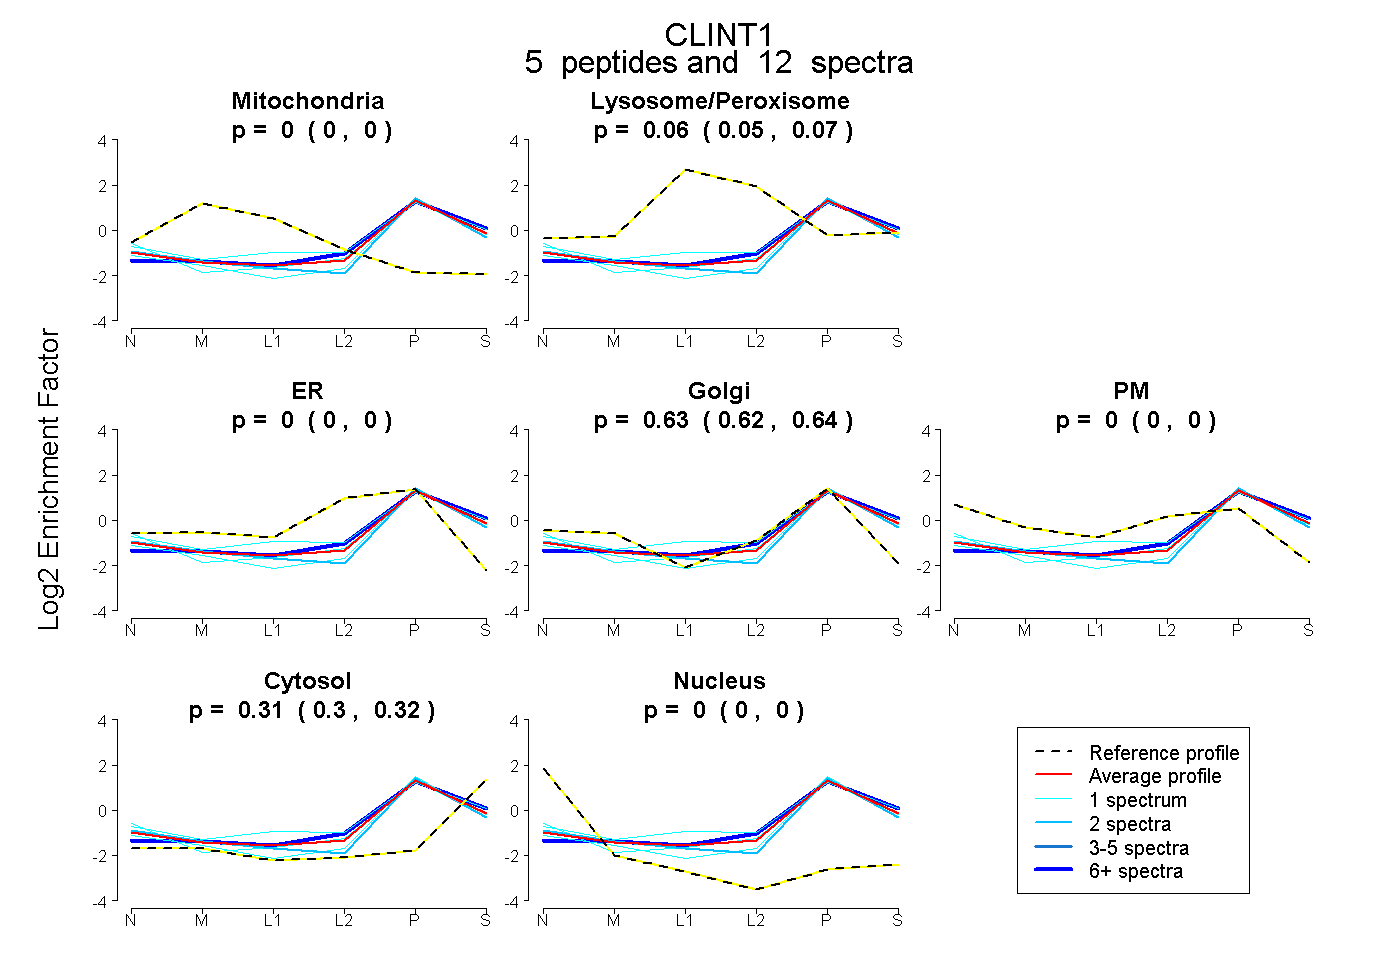 |
0.000
0.000 | 0.000 |
|
0.059
0.046 | 0.070 |
|
0.000
0.000 | 0.000 |
0.628
0.617 | 0.637 |
0.000
0.000 | 0.000 |
0.313
0.301 | 0.323 |
0.000
0.000 | 0.000 |
|
| 1 spectrum, YDPEPK |
0.000 |
|
0.183 |
|
0.000 |
0.581 |
0.000 |
0.237 |
0.000 |
|
| 2 spectra, VVTSAR |
0.000 |
|
0.000 |
|
0.000 |
0.689 |
0.000 |
0.311 |
0.000 |
|
| 7 spectra, EHIYDLR |
0.000 |
|
0.095 |
|
0.000 |
0.571 |
0.000 |
0.333 |
0.000 |
|
| 1 spectrum, SAFPFSDK |
0.000 |
|
0.000 |
|
0.000 |
0.685 |
0.000 |
0.315 |
0.000 |
|
| 1 spectrum, TANPSK |
0.000 |
|
0.064 |
|
0.000 |
0.595 |
0.000 |
0.340 |
0.000 |
|
| | | Plot |
|
Lyso |
|
|
|
|
|
|
|
Other |
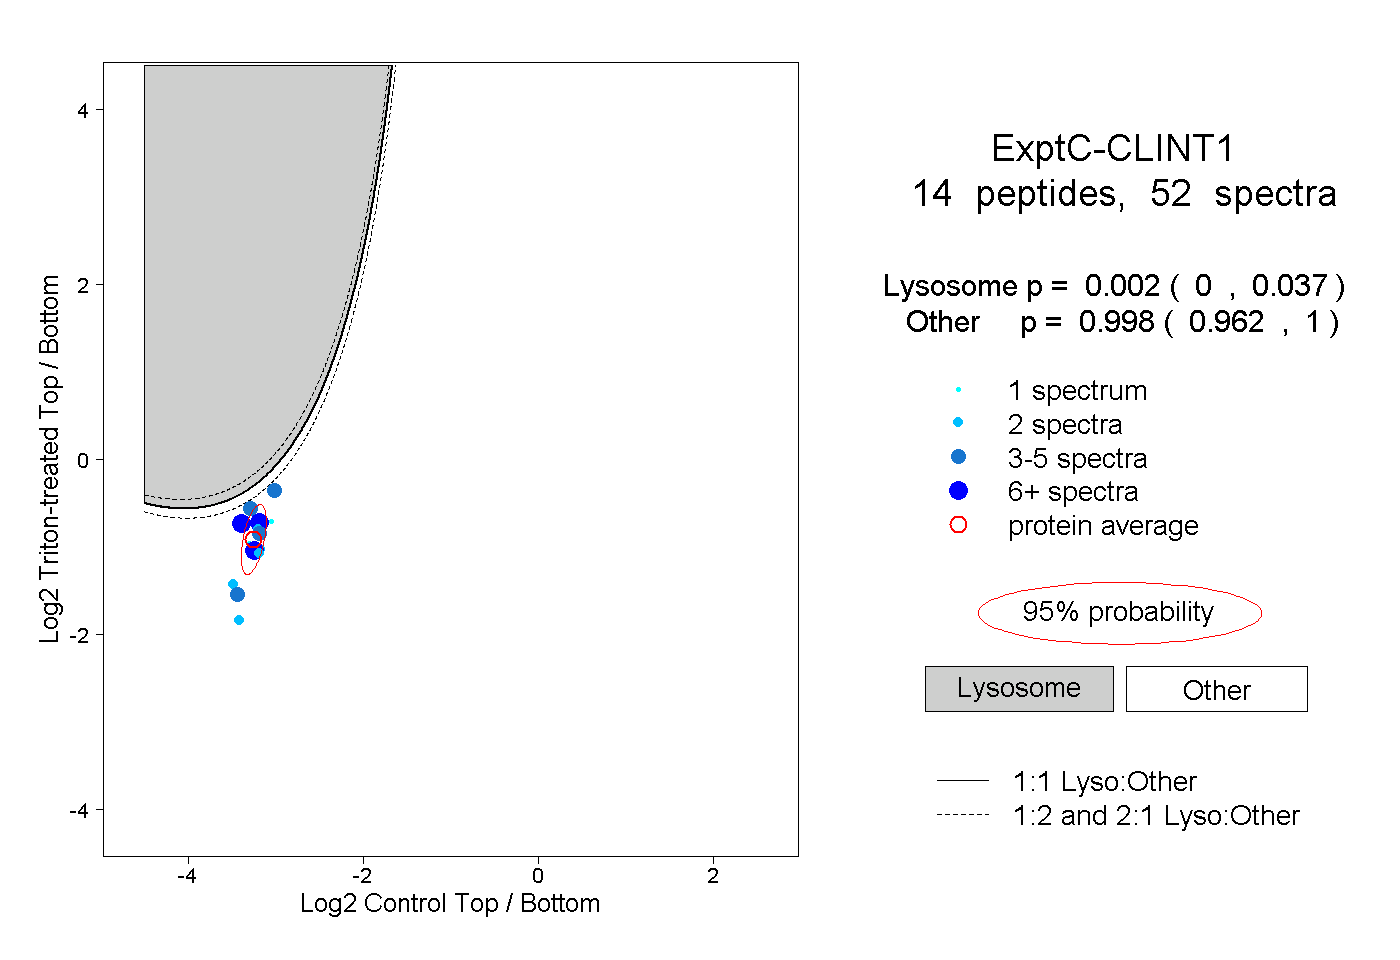
| Expt C |
14
peptides |
52
spectra |
 |
|
0.002
0.000 | 0.037 |
|
|
|
|
|
|
|
0.998
0.962 | 1.000 |
| | | Plot |
|
Lyso |
|
|
|
|
|
|
|
Other |
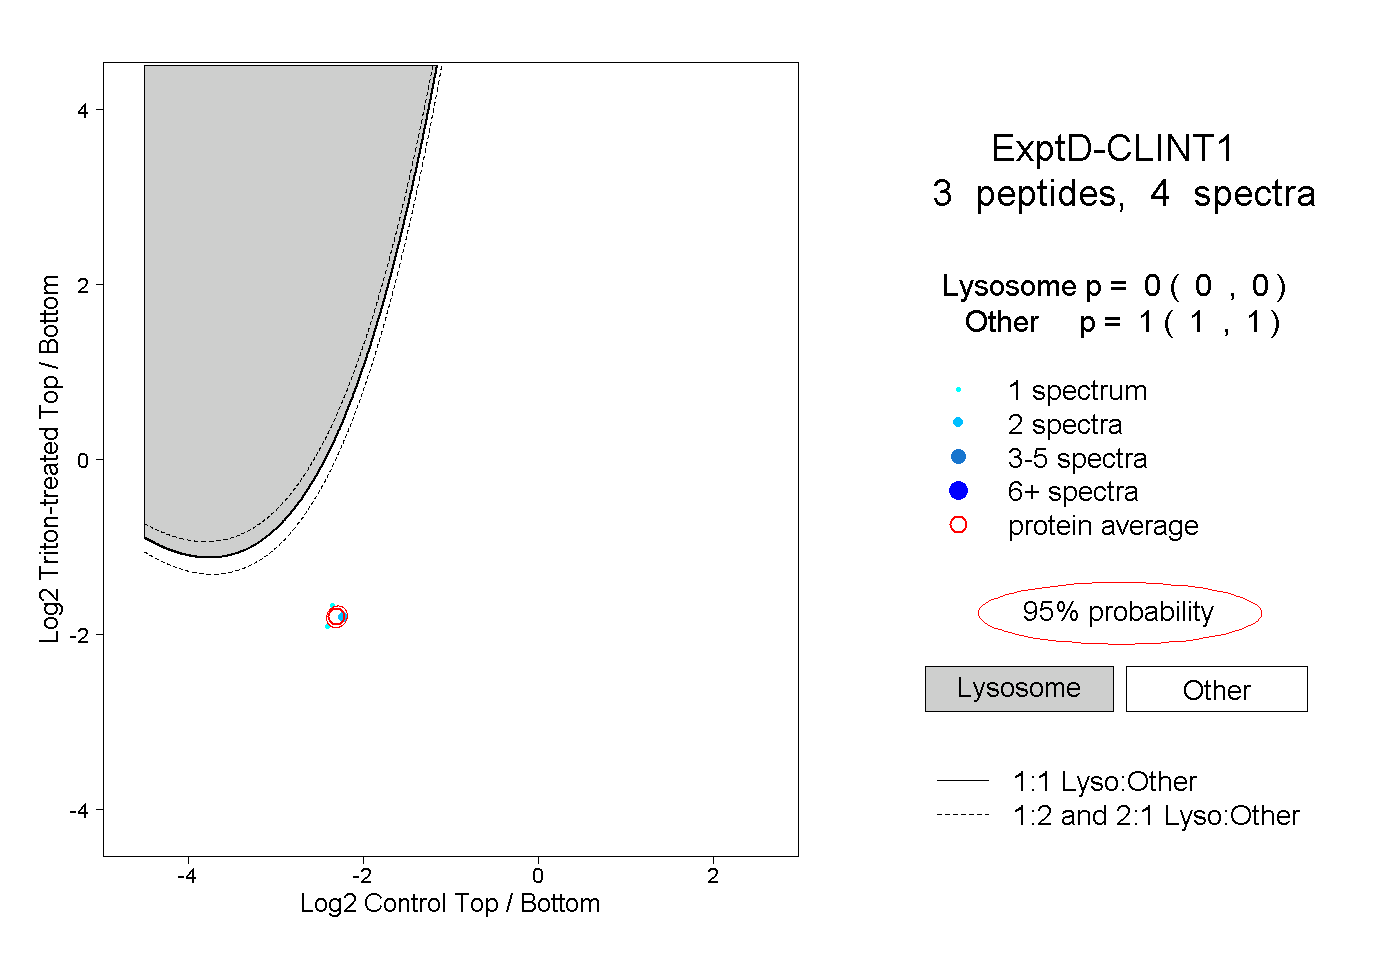
| Expt D |
3
peptides |
4
spectra |
 |
|
0.000
0.000 | 0.000 |
|
|
|
|
|
|
|
1.000
1.000 | 1.000 |