 13
13peptides
spectra
0.000 | 0.000
0.000 | 0.000
0.000 | 0.000
0.000 | 0.018
0.354 | 0.375
0.000 | 0.000
0.622 | 0.629
0.000 | 0.000
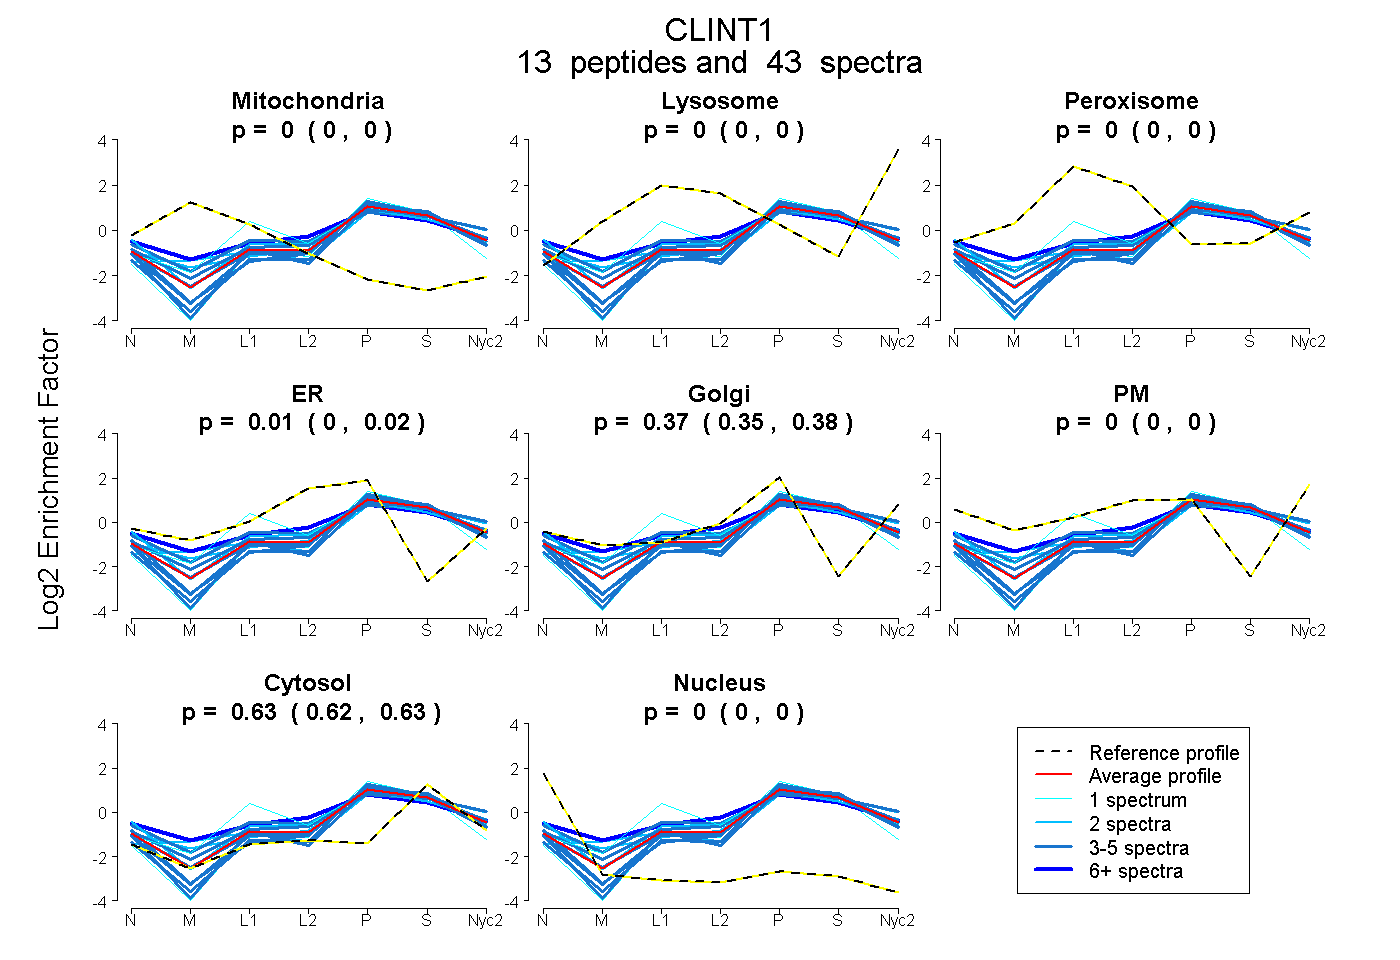
| Plot | Mito | Lyso | Perox | ER | Golgi | PM | Cytosol | Nucleus | |||||
| Expt A |
13 peptides |
43 spectra |
|
0.000 0.000 | 0.000 |
0.000 0.000 | 0.000 |
0.000 0.000 | 0.000 |
0.006 0.000 | 0.018 |
0.368 0.354 | 0.375 |
0.000 0.000 | 0.000 |
0.626 0.622 | 0.629 |
0.000 0.000 | 0.000 |
| 5 spectra, SLENYHFVDEHGK | 0.000 | 0.000 | 0.000 | 0.173 | 0.201 | 0.000 | 0.626 | 0.000 | ||
| 4 spectra, ELVEFAQDDDR | 0.000 | 0.000 | 0.000 | 0.000 | 0.323 | 0.000 | 0.677 | 0.000 | ||
| 2 spectra, SAFPFSDK | 0.000 | 0.000 | 0.000 | 0.149 | 0.266 | 0.000 | 0.585 | 0.000 | ||
| 4 spectra, TANPSK | 0.000 | 0.000 | 0.000 | 0.000 | 0.304 | 0.000 | 0.696 | 0.000 | ||
| 2 spectra, DQGINIR | 0.000 | 0.007 | 0.000 | 0.000 | 0.434 | 0.000 | 0.560 | 0.000 | ||
| 5 spectra, VVTSAR | 0.000 | 0.000 | 0.000 | 0.000 | 0.391 | 0.000 | 0.609 | 0.000 | ||
| 1 spectrum, EATNDDPWGPSGQLMGEIAK | 0.000 | 0.000 | 0.000 | 0.020 | 0.247 | 0.000 | 0.733 | 0.000 | ||
| 4 spectra, YVGVSSDSVGGFR | 0.000 | 0.000 | 0.000 | 0.000 | 0.263 | 0.000 | 0.737 | 0.000 | ||
| 6 spectra, EHIYDLR | 0.000 | 0.000 | 0.104 | 0.156 | 0.244 | 0.000 | 0.496 | 0.000 | ||
| 4 spectra, LGELSDK | 0.000 | 0.000 | 0.000 | 0.000 | 0.344 | 0.000 | 0.656 | 0.000 | ||
| 2 spectra, ATNVVMNYSEIESK | 0.000 | 0.002 | 0.005 | 0.000 | 0.360 | 0.000 | 0.633 | 0.000 | ||
| 1 spectrum, TIDLGAAAHYTGDK | 0.000 | 0.000 | 0.177 | 0.119 | 0.180 | 0.000 | 0.525 | 0.000 | ||
| 3 spectra, HIHITQATETTTTR | 0.000 | 0.000 | 0.123 | 0.000 | 0.355 | 0.000 | 0.522 | 0.000 |
| Plot | Mito | Lyso or Perox | ER | Golgi | PM | Cytosol | Nucleus | ||||||
| Expt B |
5 peptides |
12 spectra |
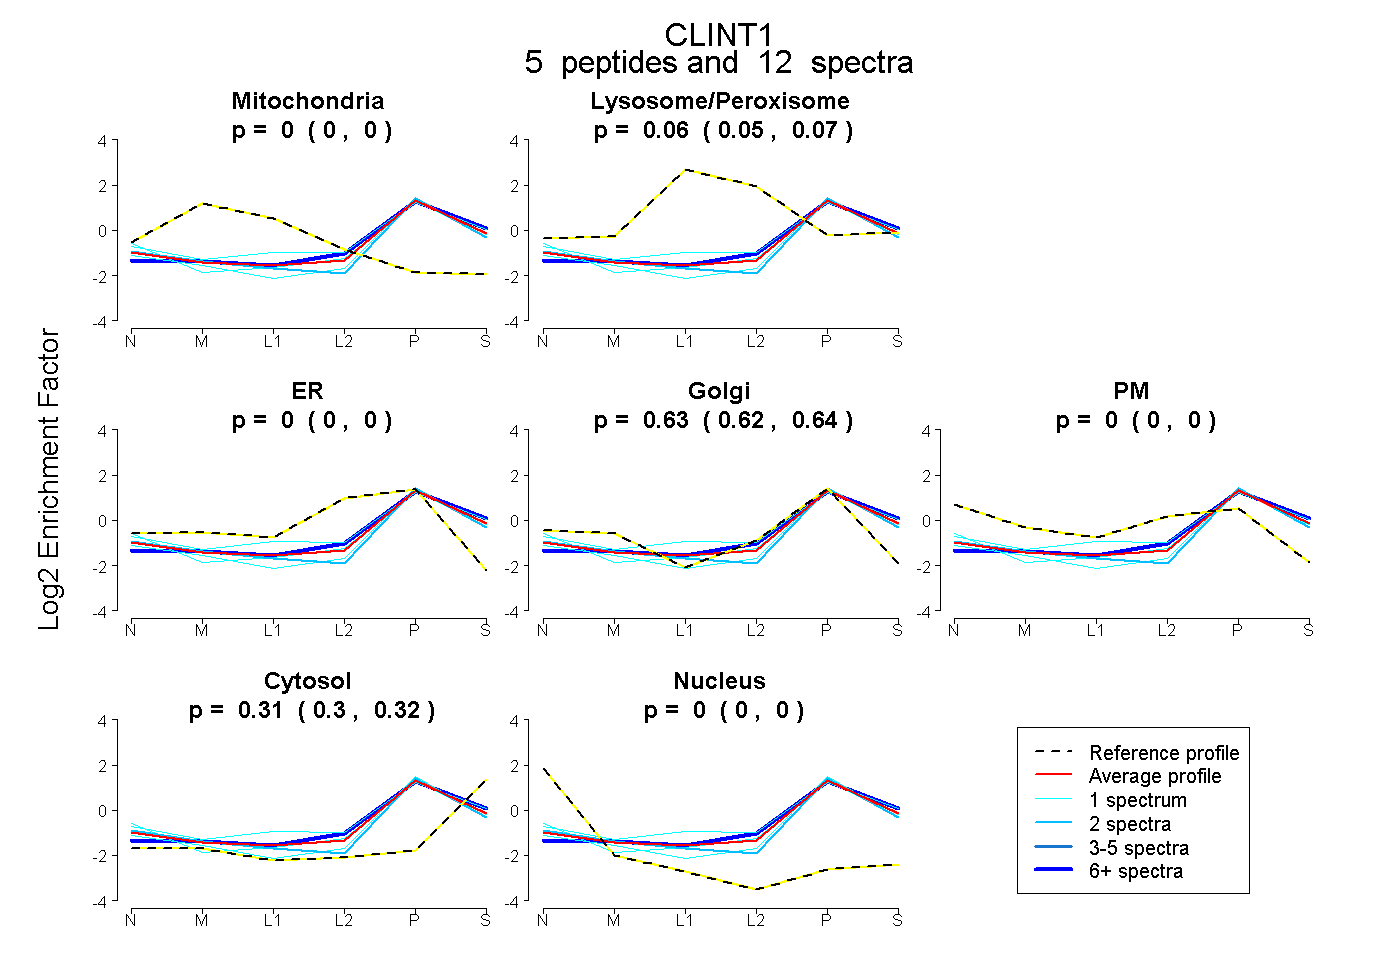 |
0.000 0.000 | 0.000 |
0.059 0.046 | 0.070 |
0.000 0.000 | 0.000 |
0.628 0.617 | 0.637 |
0.000 0.000 | 0.000 |
0.313 0.301 | 0.323 |
0.000 0.000 | 0.000 |
|||
| Plot | Lyso | Other | |||||||||||
| Expt C |
14 peptides |
52 spectra |
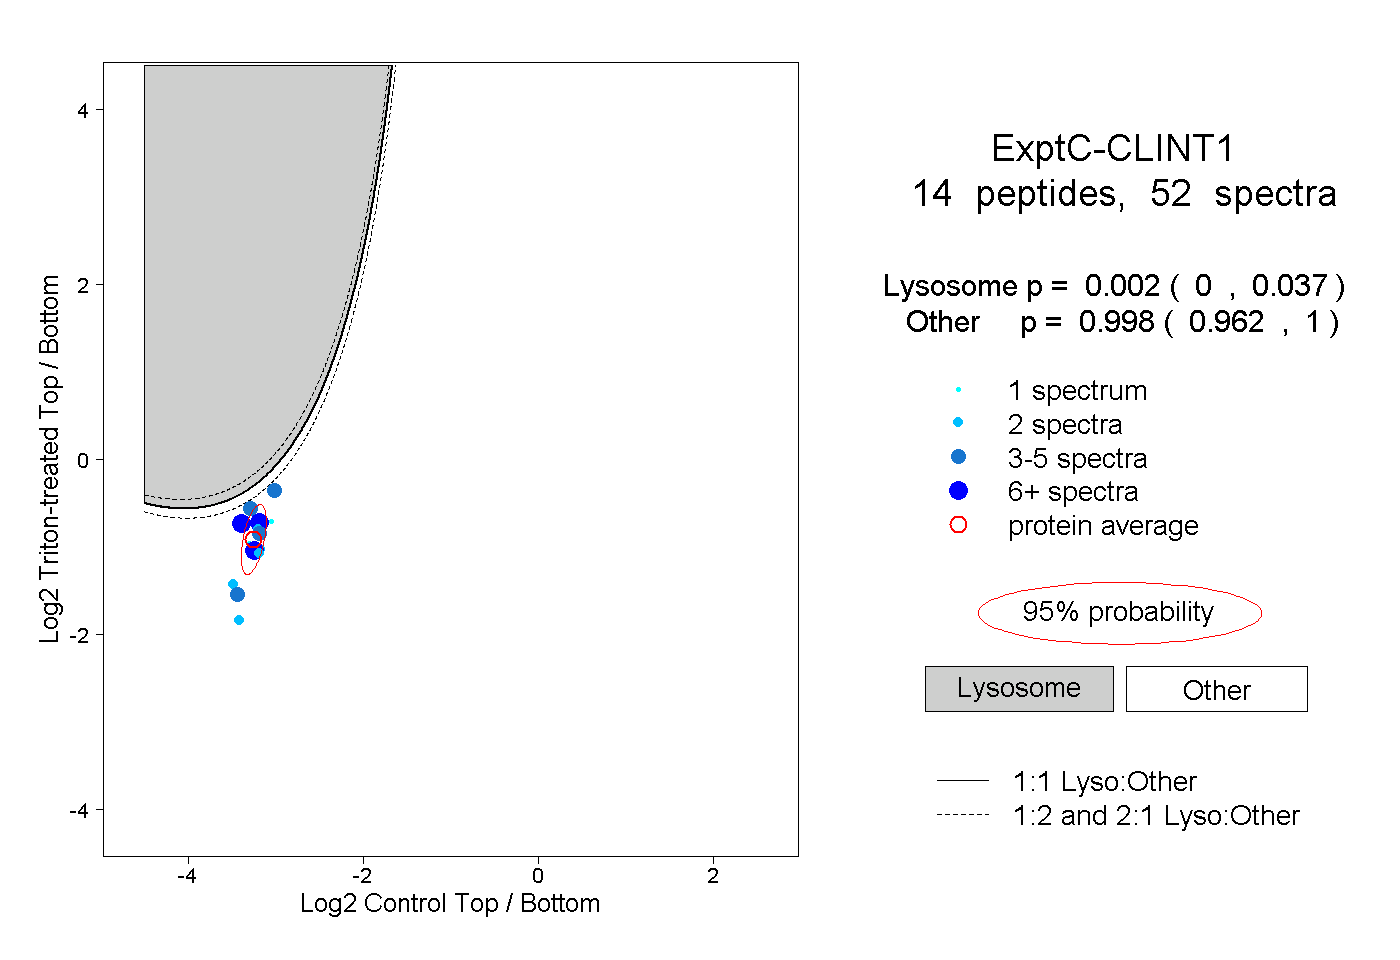 |
0.002 0.000 | 0.037 |
0.998 0.962 | 1.000 |
||||||||
| Plot | Lyso | Other | |||||||||||
| Expt D |
3 peptides |
4 spectra |
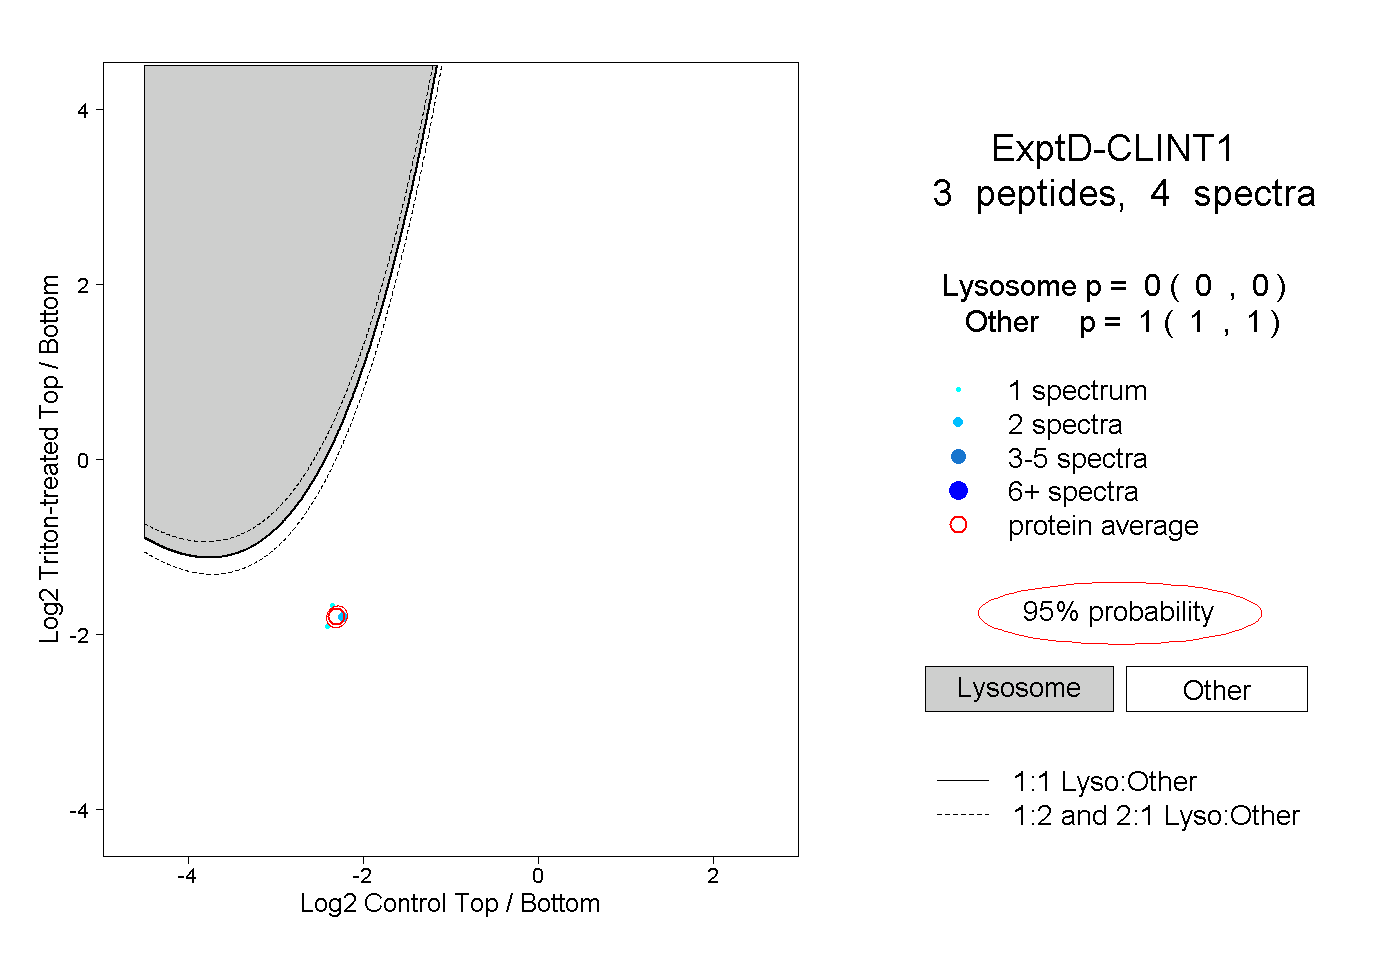 |
0.000 0.000 | 0.000 |
1.000 1.000 | 1.000 |