 1
1peptide
spectra
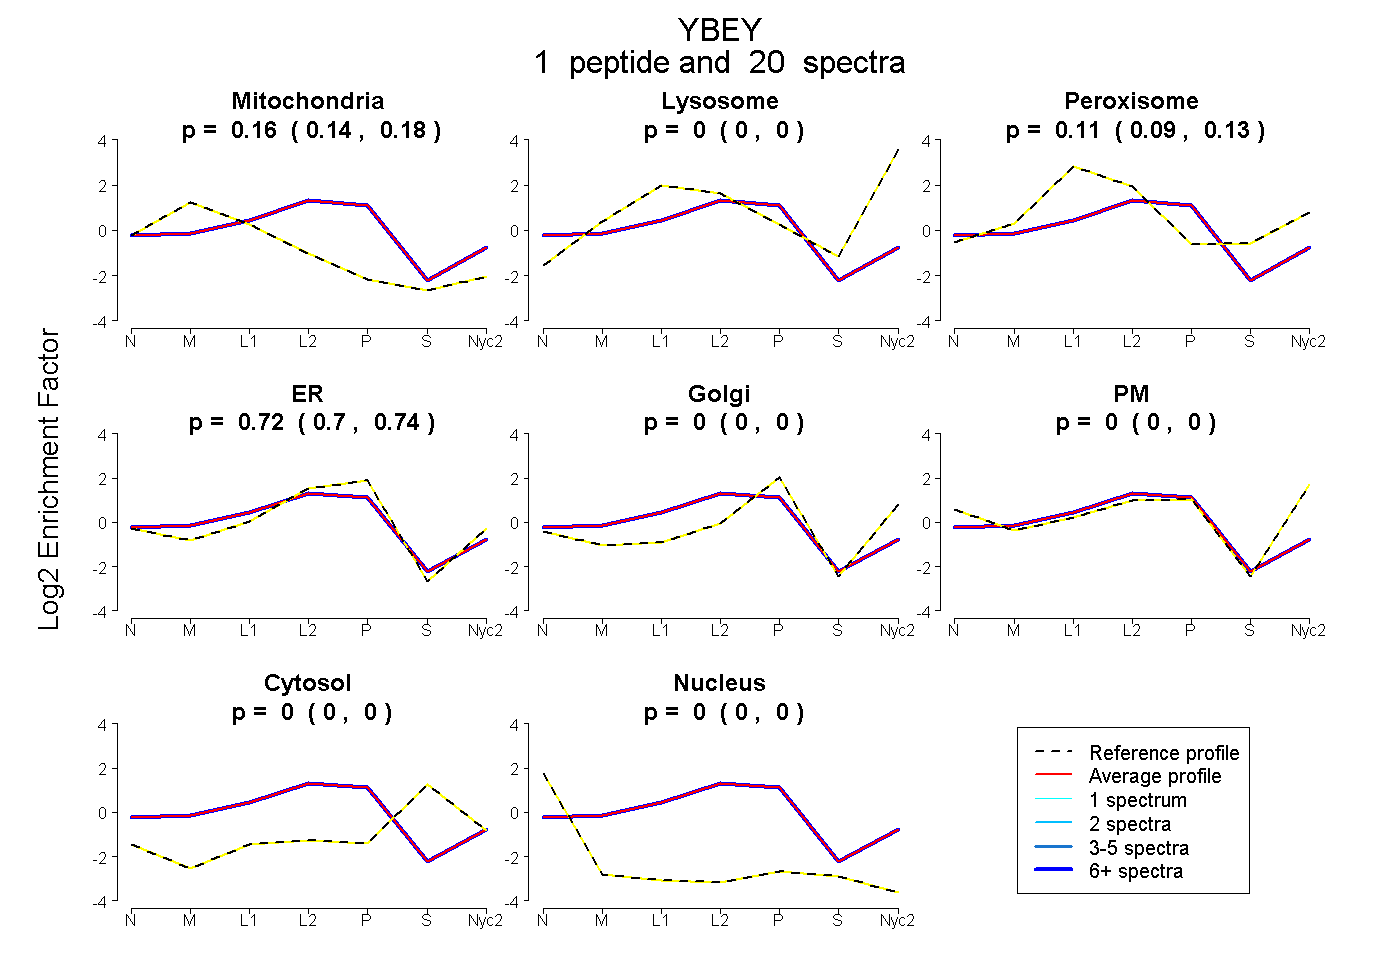
0.145 | 0.177
0.000 | 0.000
0.089 | 0.134
0.698 | 0.744
0.000 | 0.000
0.000 | 0.000
0.000 | 0.004
0.000 | 0.000
1peptide
spectra
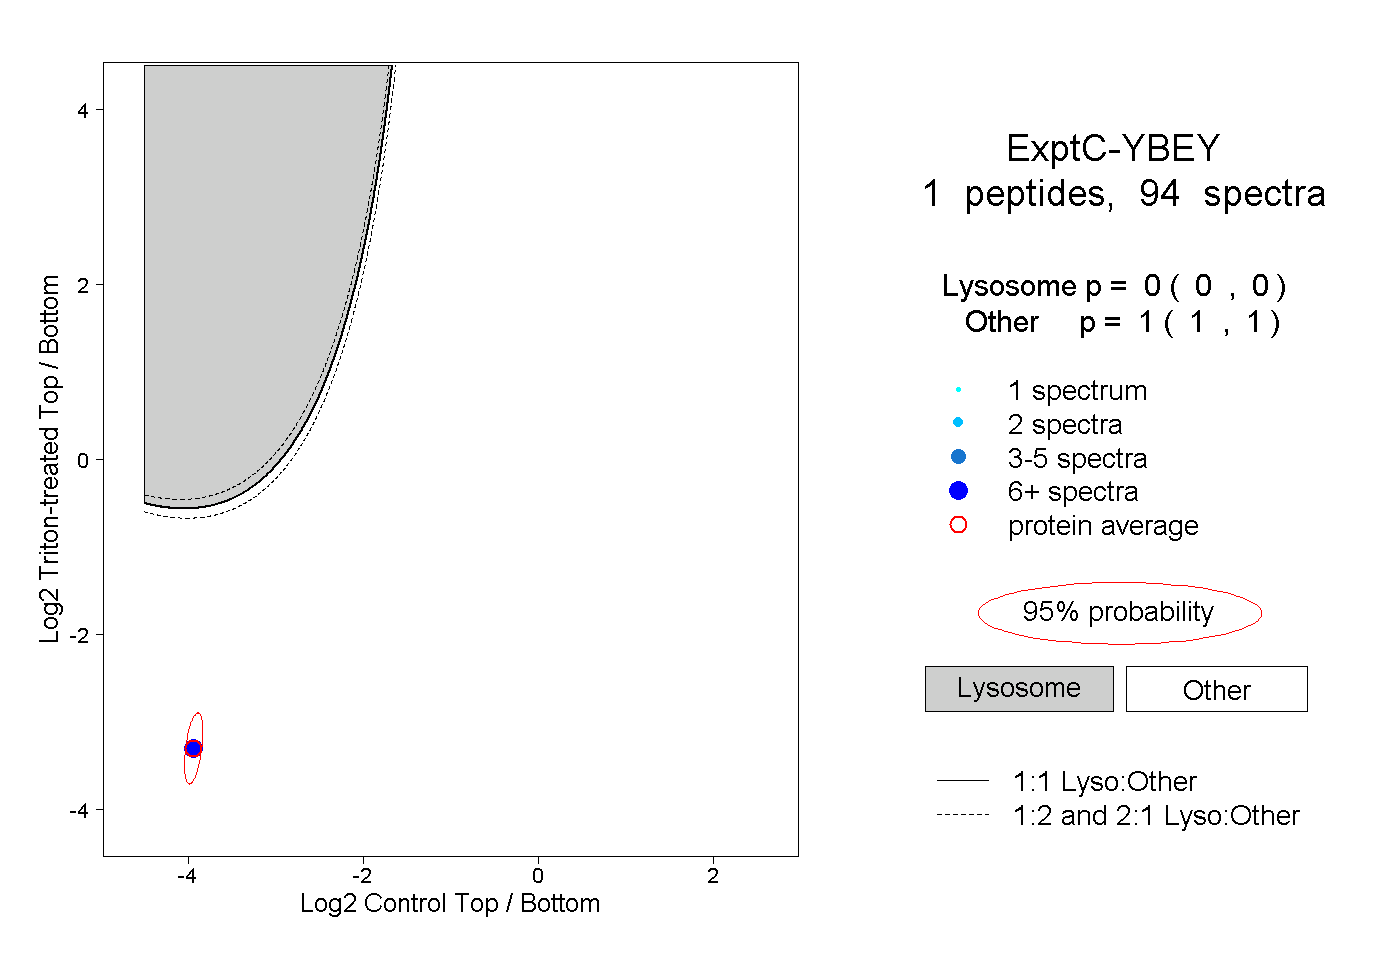
0.000 | 0.000
1.000 | 1.000
1peptide
spectra
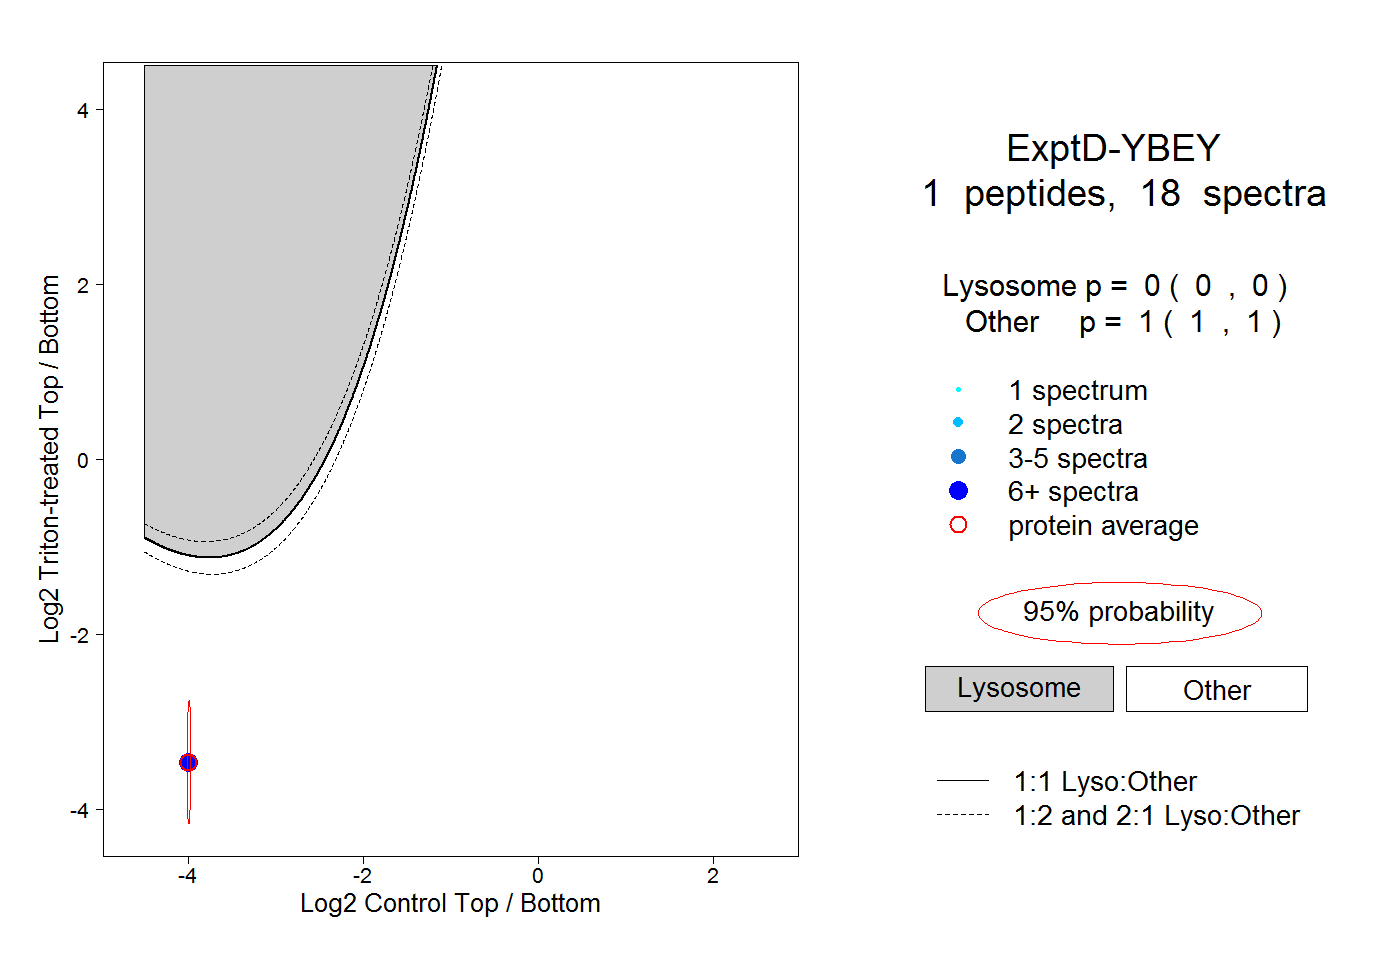
0.000 | 0.000
1.000 | 1.000