 4
4peptides
spectra
0.000 | 0.011
0.000 | 0.000
0.006 | 0.114
0.000 | 0.177
0.000 | 0.129
0.276 | 0.451
0.386 | 0.480
0.000 | 0.000
1peptide
spectrum
NA | NA
NA | NA
| Plot | Mito | Lyso | Perox | ER | Golgi | PM | Cytosol | Nucleus | |||||
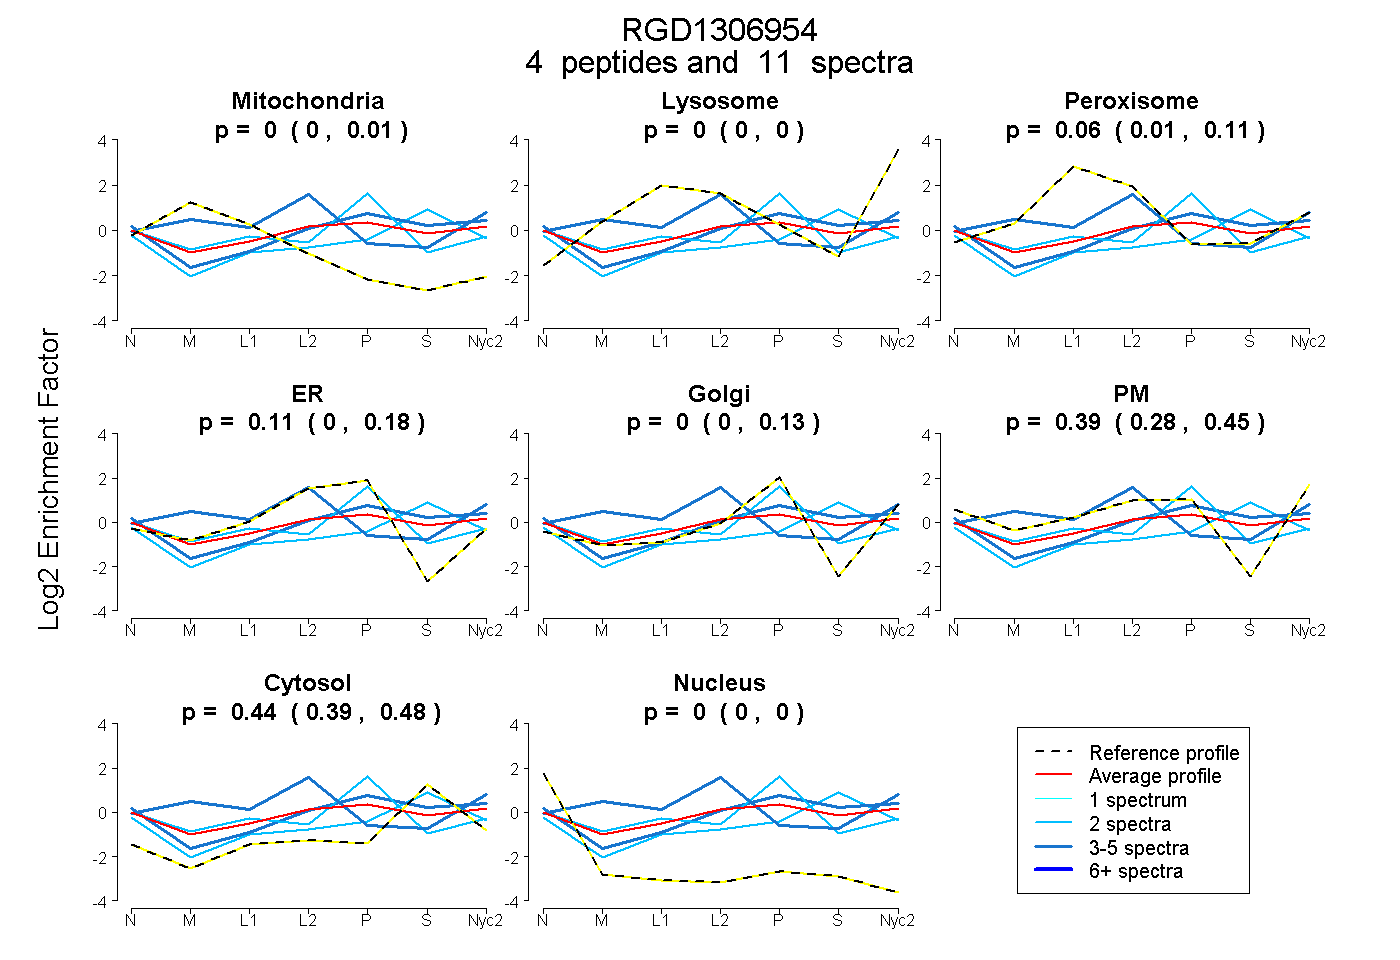
| Expt A |
4 peptides |
11 spectra |
|
0.000 0.000 | 0.011 |
0.000 0.000 | 0.000 |
0.060 0.006 | 0.114 |
0.106 0.000 | 0.177 |
0.000 0.000 | 0.129 |
0.392 0.276 | 0.451 |
0.442 0.386 | 0.480 |
0.000 0.000 | 0.000 |
||
| Plot | Lyso | Other | |||||||||||
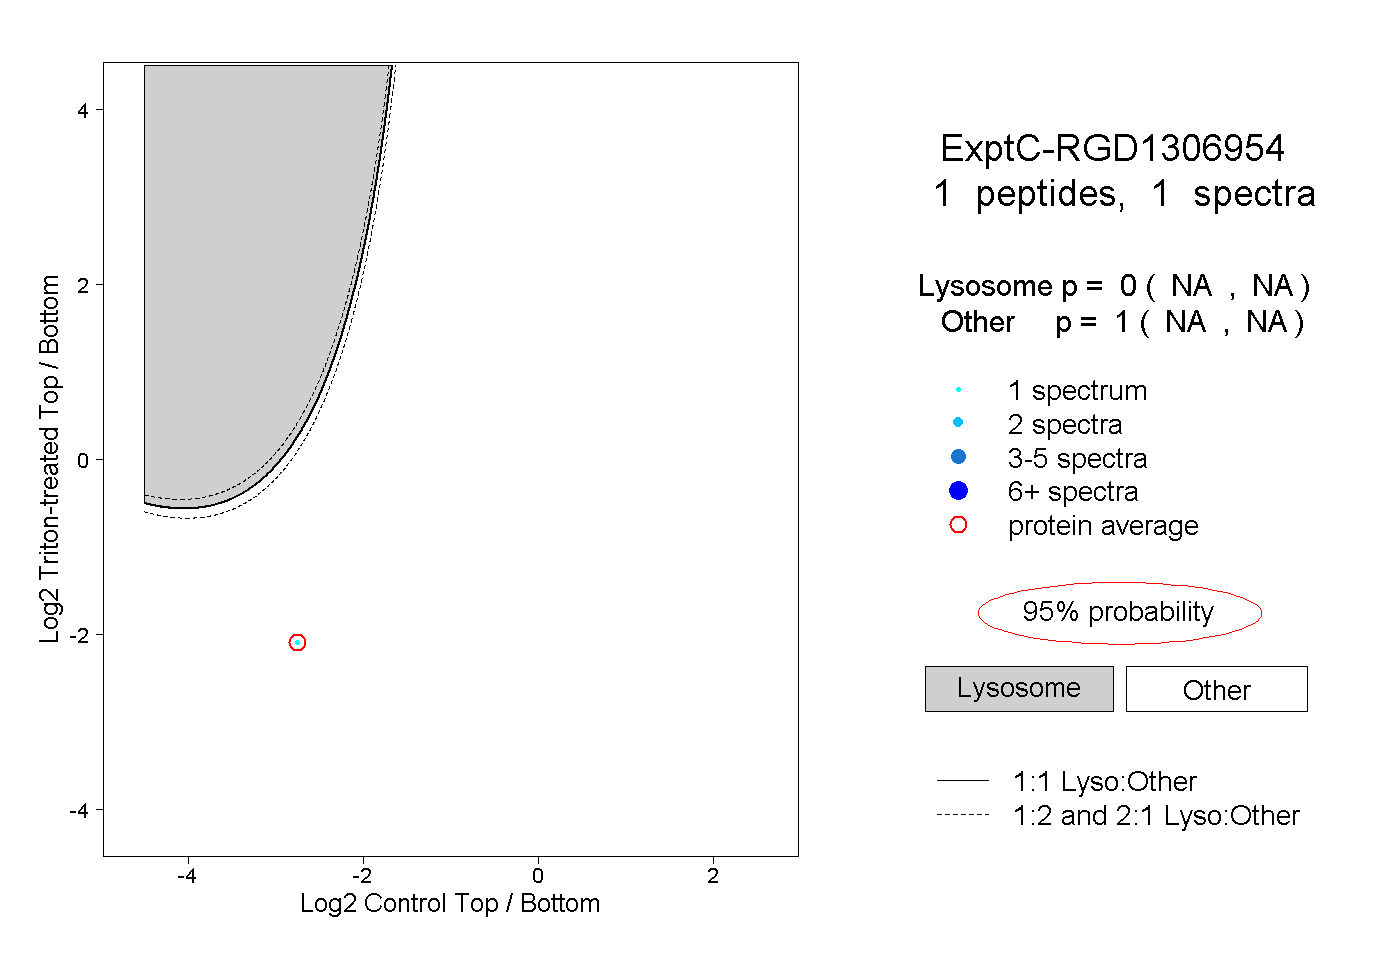
| Expt C |
1 peptide |
1 spectrum |
|
0.000 NA | NA |
1.000 NA | NA |