 3
3peptides
spectra
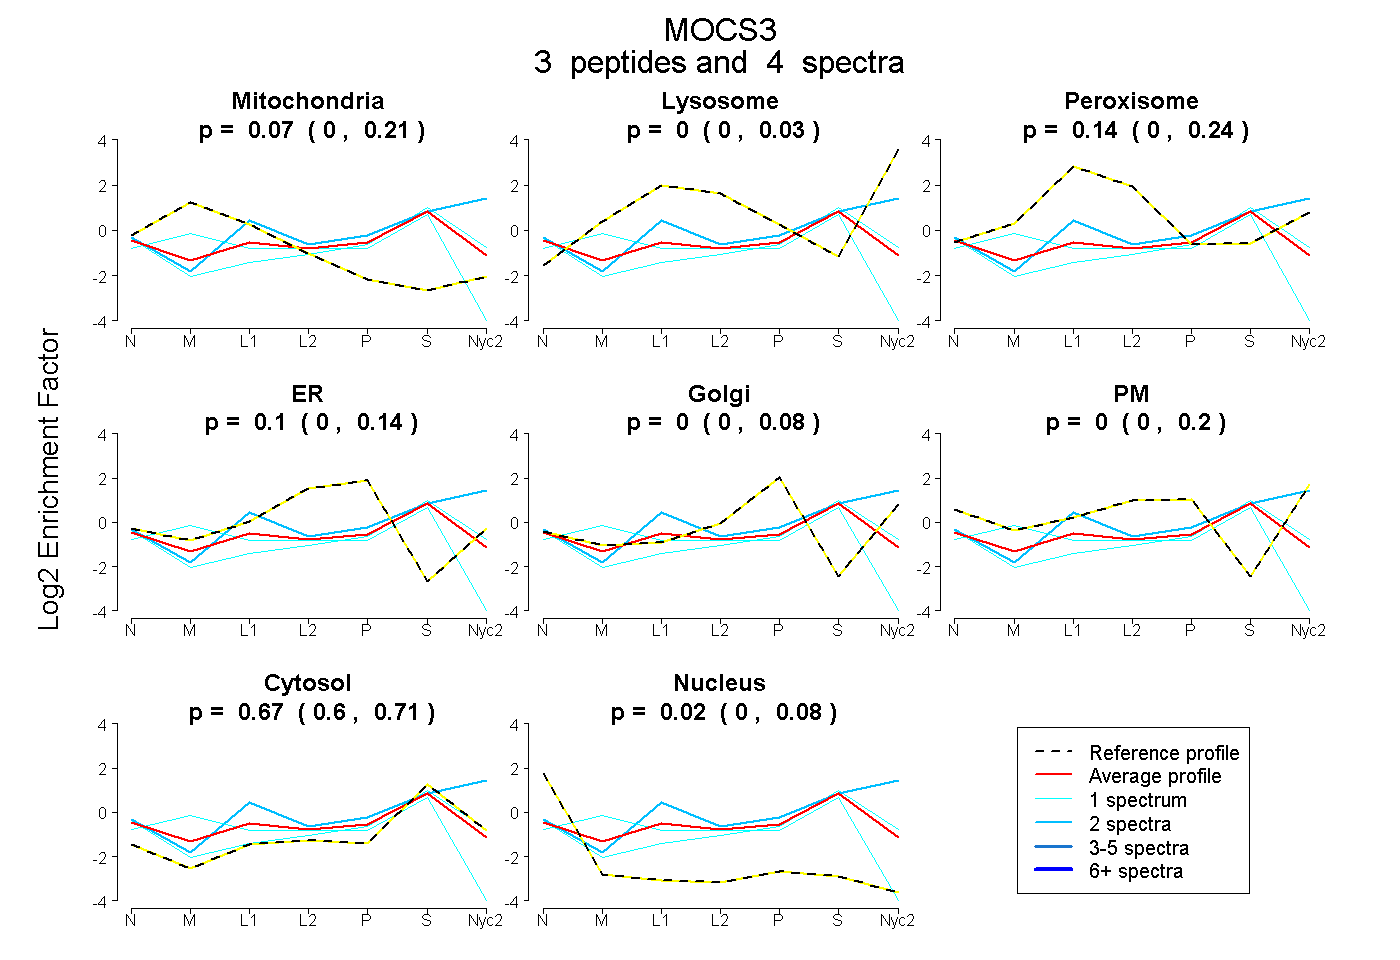
0.000 | 0.209
0.000 | 0.028
0.000 | 0.241
0.000 | 0.140
0.000 | 0.079
0.000 | 0.199
0.596 | 0.715
0.000 | 0.084
1peptide
spectrum
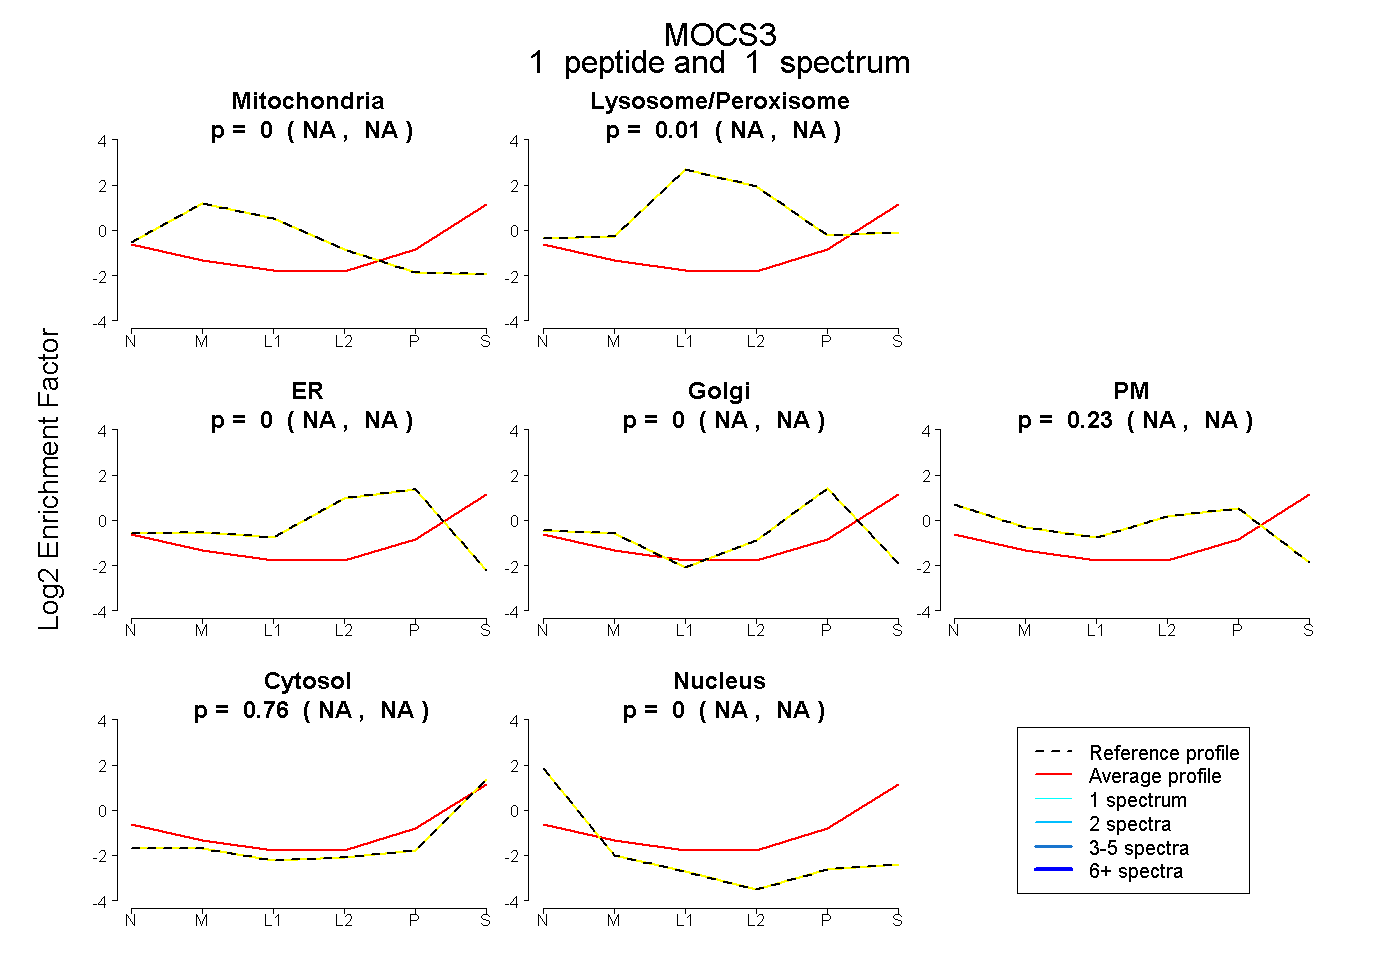
NA | NA
NA | NA
NA | NA
NA | NA
NA | NA
NA | NA
NA | NA
2peptides
spectra
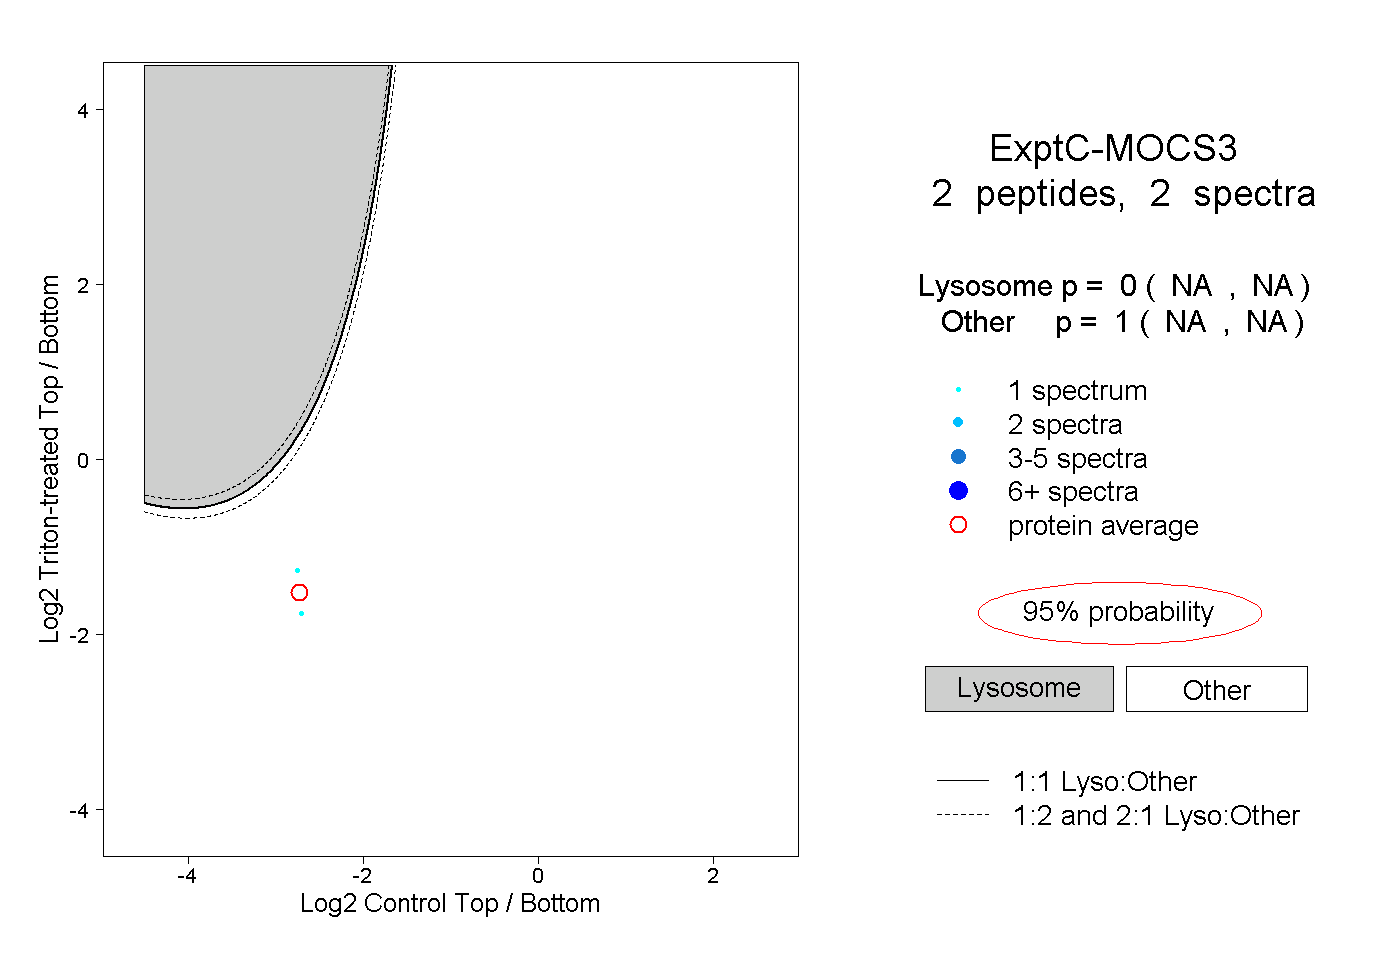
NA | NA
NA | NA