 2
2peptides
spectra
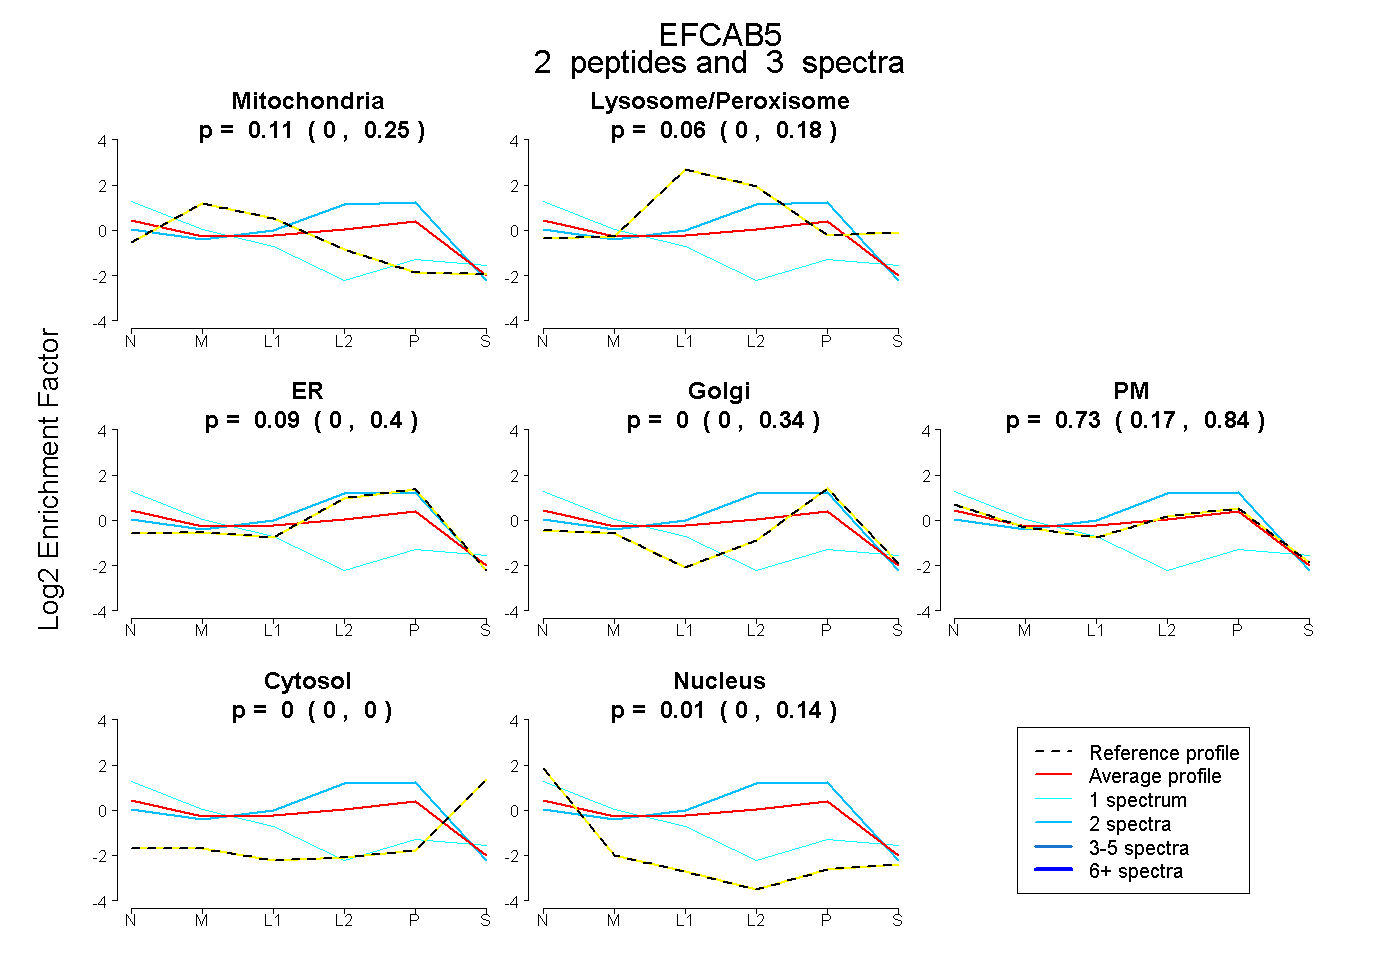
0.000 | 0.246
0.004 | 0.181
0.000 | 0.397
0.000 | 0.343
0.174 | 0.844
0.000 | 0.000
0.000 | 0.138
2peptides
spectra
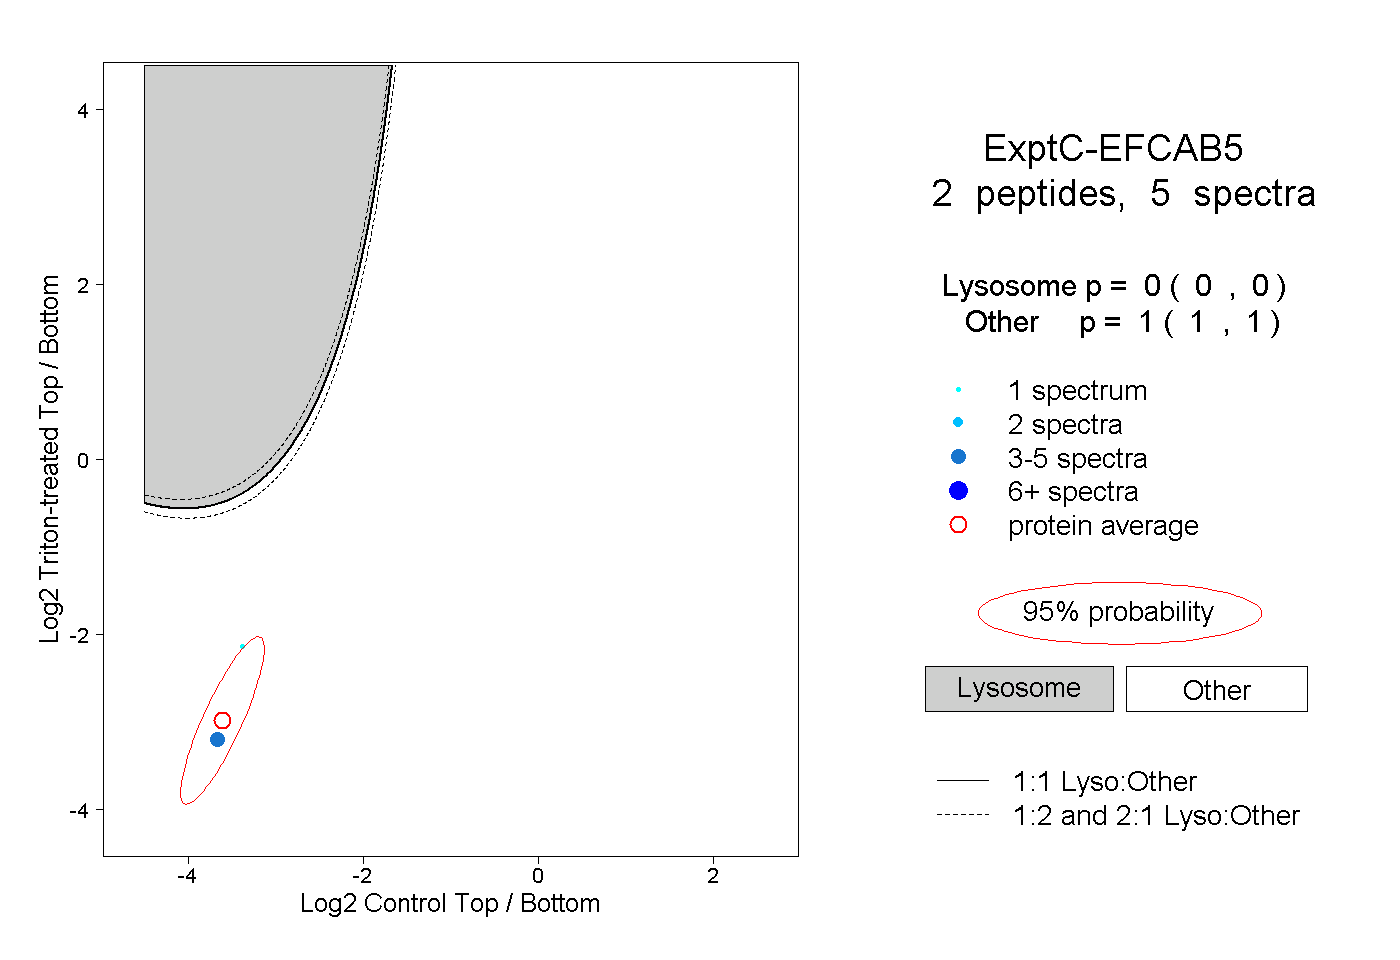
0.000 | 0.000
1.000 | 1.000
1peptide
spectra
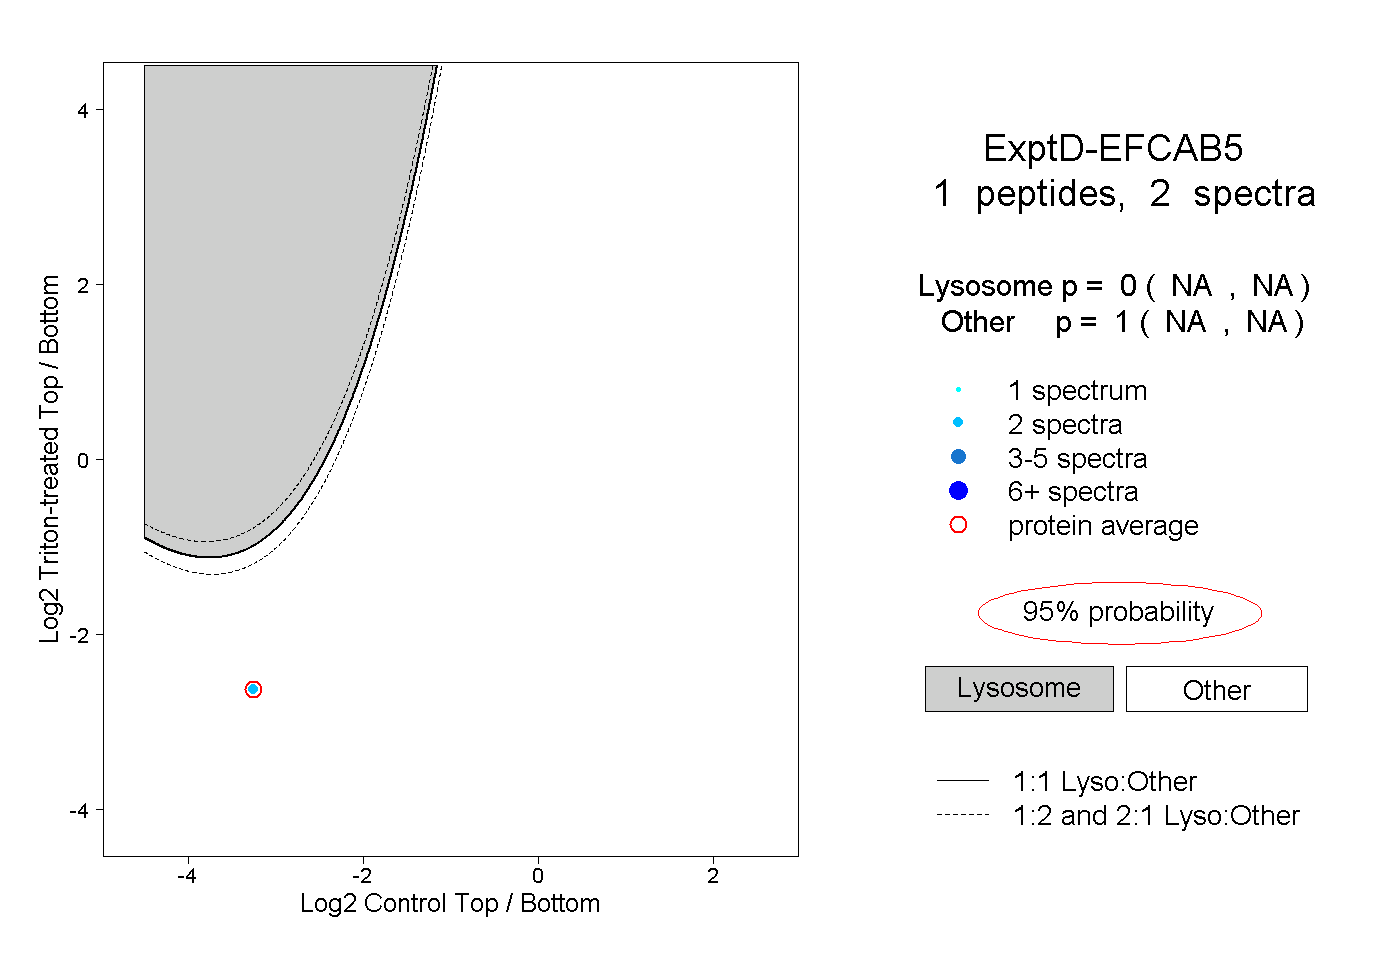
NA | NA
NA | NA