 13
13peptides
spectra
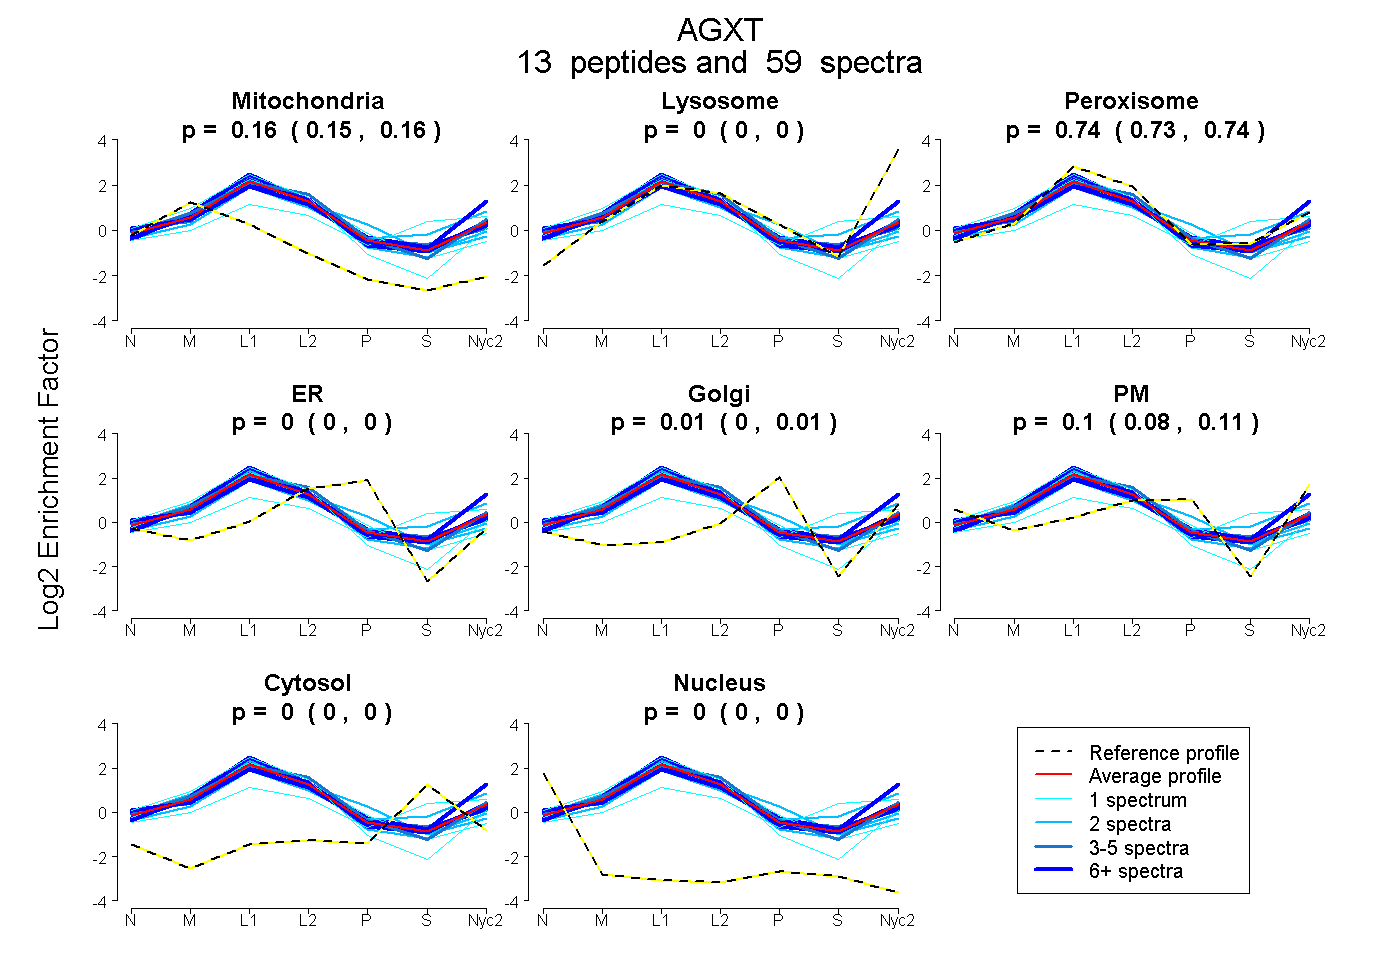
0.151 | 0.159
0.000 | 0.000
0.732 | 0.744
0.000 | 0.000
0.000 | 0.014
0.084 | 0.110
0.000 | 0.000
0.000 | 0.000
| Plot | Mito | Lyso | Perox | ER | Golgi | PM | Cytosol | Nucleus | |||||
| Expt A |
13 peptides |
59 spectra |
|
0.155 0.151 | 0.159 |
0.000 0.000 | 0.000 |
0.739 0.732 | 0.744 |
0.000 0.000 | 0.000 |
0.006 0.000 | 0.014 |
0.100 0.084 | 0.110 |
0.000 0.000 | 0.000 |
0.000 0.000 | 0.000 |
| 4 spectra, VHQMIK | 0.131 | 0.000 | 0.703 | 0.014 | 0.000 | 0.152 | 0.000 | 0.000 | ||
| 12 spectra, QGIQYVFQTR | 0.165 | 0.000 | 0.741 | 0.000 | 0.000 | 0.093 | 0.000 | 0.000 | ||
| 2 spectra, LLLGPGPSNLAPR | 0.213 | 0.000 | 0.705 | 0.082 | 0.000 | 0.000 | 0.000 | 0.000 | ||
| 2 spectra, ESLALISEQGLENSWR | 0.028 | 0.080 | 0.670 | 0.000 | 0.000 | 0.081 | 0.140 | 0.000 | ||
| 1 spectrum, VAEALR | 0.020 | 0.079 | 0.564 | 0.000 | 0.000 | 0.021 | 0.315 | 0.000 | ||
| 2 spectra, IGLLGYNATTENADR | 0.186 | 0.000 | 0.755 | 0.000 | 0.000 | 0.059 | 0.000 | 0.000 | ||
| 11 spectra, EMFQIMDEIK | 0.133 | 0.000 | 0.787 | 0.000 | 0.080 | 0.000 | 0.000 | 0.000 | ||
| 1 spectrum, VLNAPPGISLISFNDK | 0.274 | 0.000 | 0.672 | 0.000 | 0.000 | 0.054 | 0.000 | 0.000 | ||
| 6 spectra, MIGHMQK | 0.158 | 0.000 | 0.818 | 0.024 | 0.000 | 0.000 | 0.000 | 0.000 | ||
| 12 spectra, VLAAGSLR | 0.066 | 0.125 | 0.610 | 0.000 | 0.000 | 0.174 | 0.007 | 0.019 | ||
| 3 spectra, EATAHLHK | 0.079 | 0.000 | 0.843 | 0.020 | 0.000 | 0.000 | 0.000 | 0.058 | ||
| 2 spectra, EALQHCPK | 0.132 | 0.000 | 0.649 | 0.219 | 0.000 | 0.000 | 0.000 | 0.000 | ||
| 1 spectrum, LWGCEGK | 0.202 | 0.000 | 0.650 | 0.148 | 0.000 | 0.000 | 0.000 | 0.000 |
| Plot | Mito | Lyso or Perox | ER | Golgi | PM | Cytosol | Nucleus | ||||||
| Expt B |
9 peptides |
30 spectra |
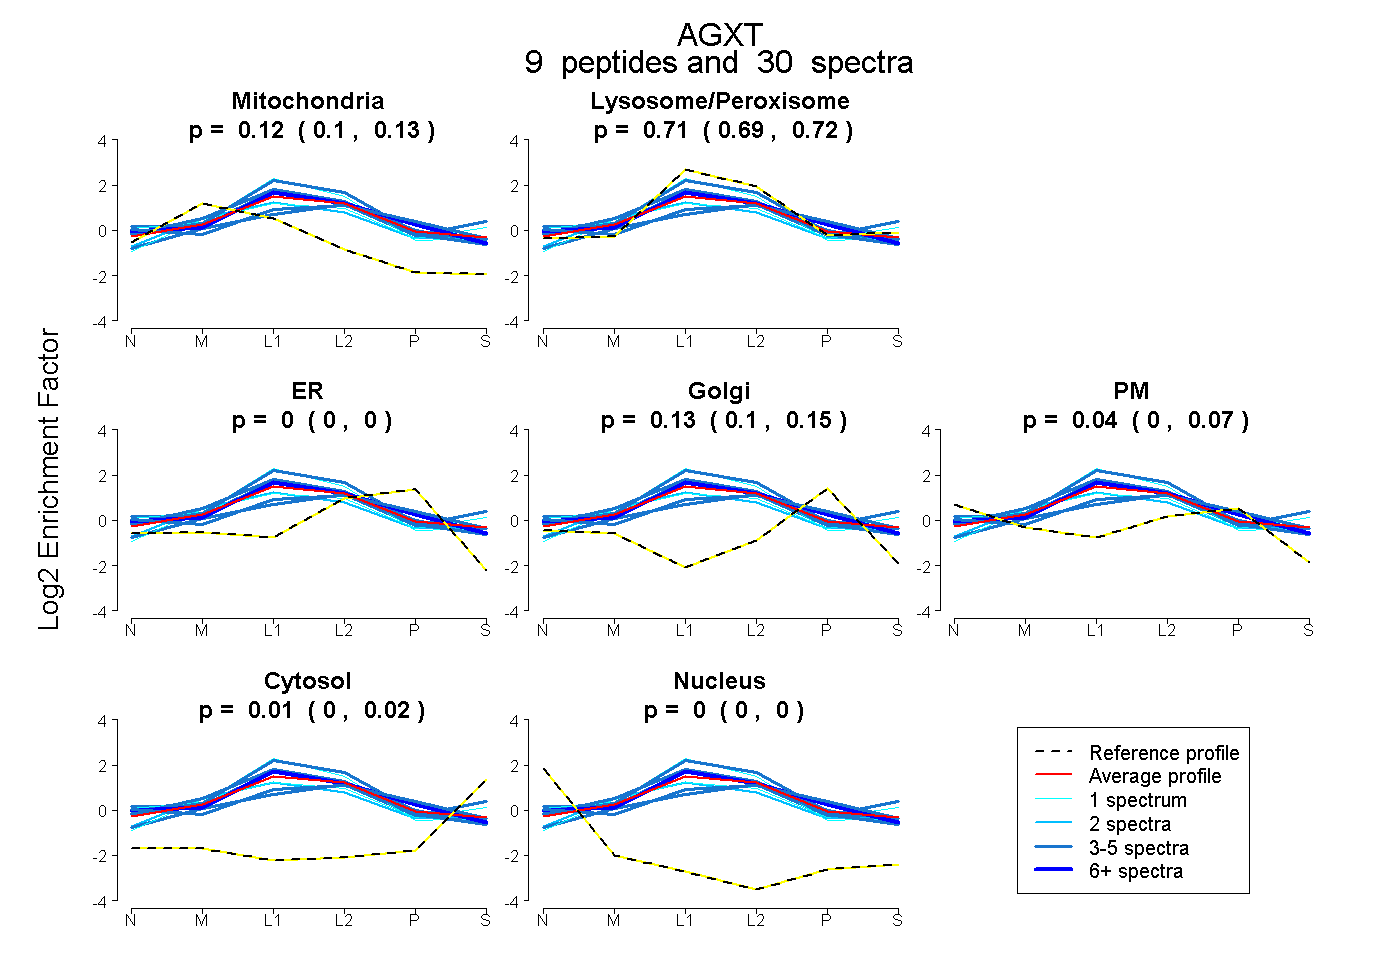 |
0.116 0.104 | 0.127 |
0.705 0.691 | 0.719 |
0.000 0.000 | 0.000 |
0.128 0.099 | 0.150 |
0.041 0.000 | 0.073 |
0.010 0.001 | 0.019 |
0.000 0.000 | 0.000 |
|||
| Plot | Lyso | Other | |||||||||||
| Expt C |
18 peptides |
402 spectra |
 |
0.000 0.000 | 0.000 |
1.000 1.000 | 1.000 |
||||||||
| Plot | Lyso | Other | |||||||||||
| Expt D |
9 peptides |
48 spectra |
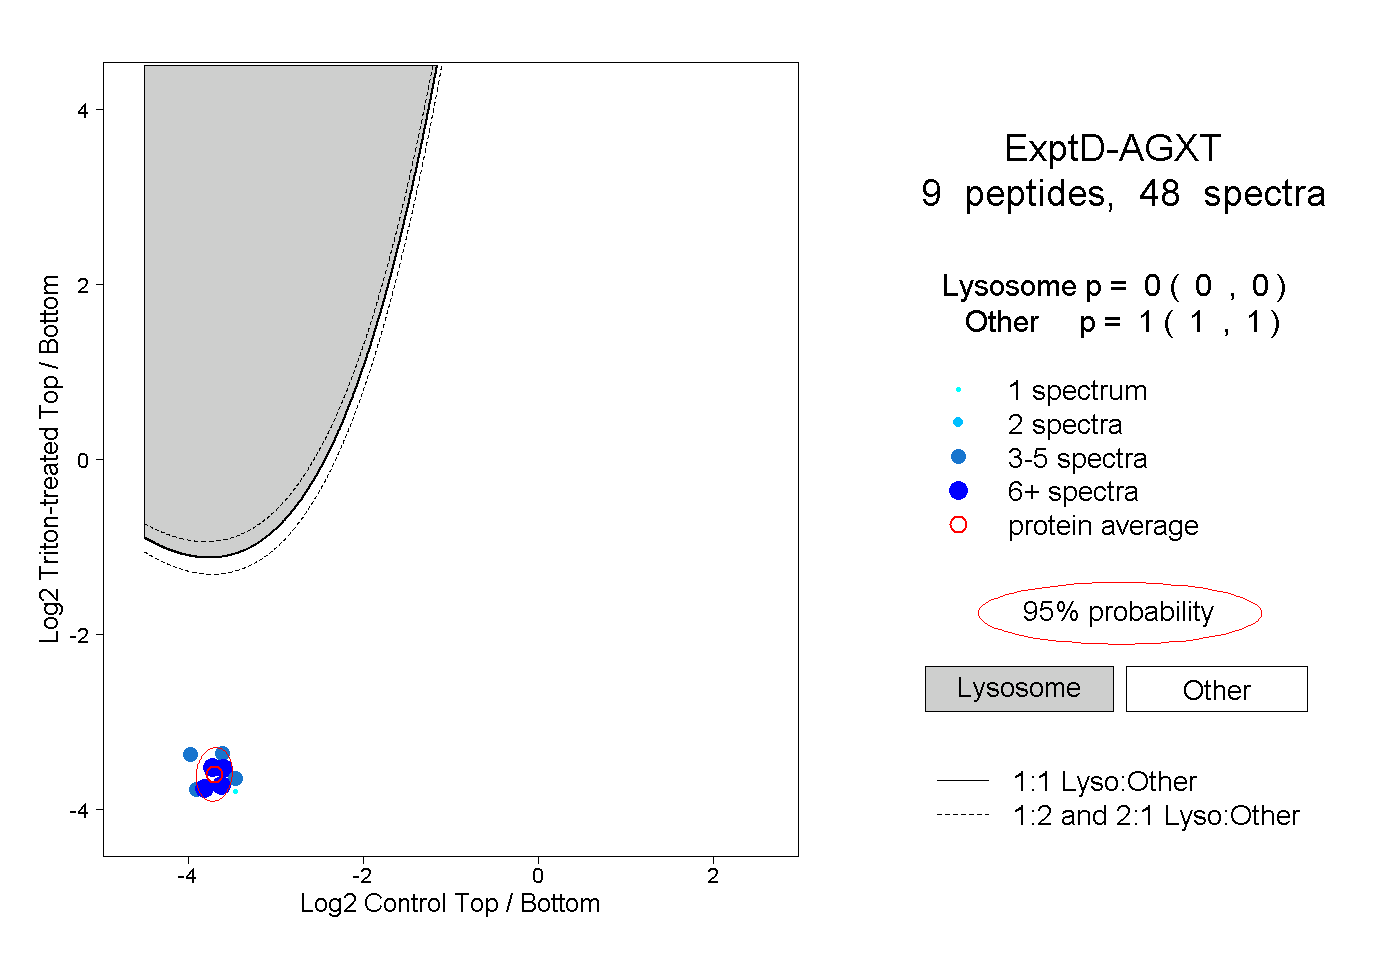 |
0.000 0.000 | 0.000 |
1.000 1.000 | 1.000 |