 2
2peptides
spectra
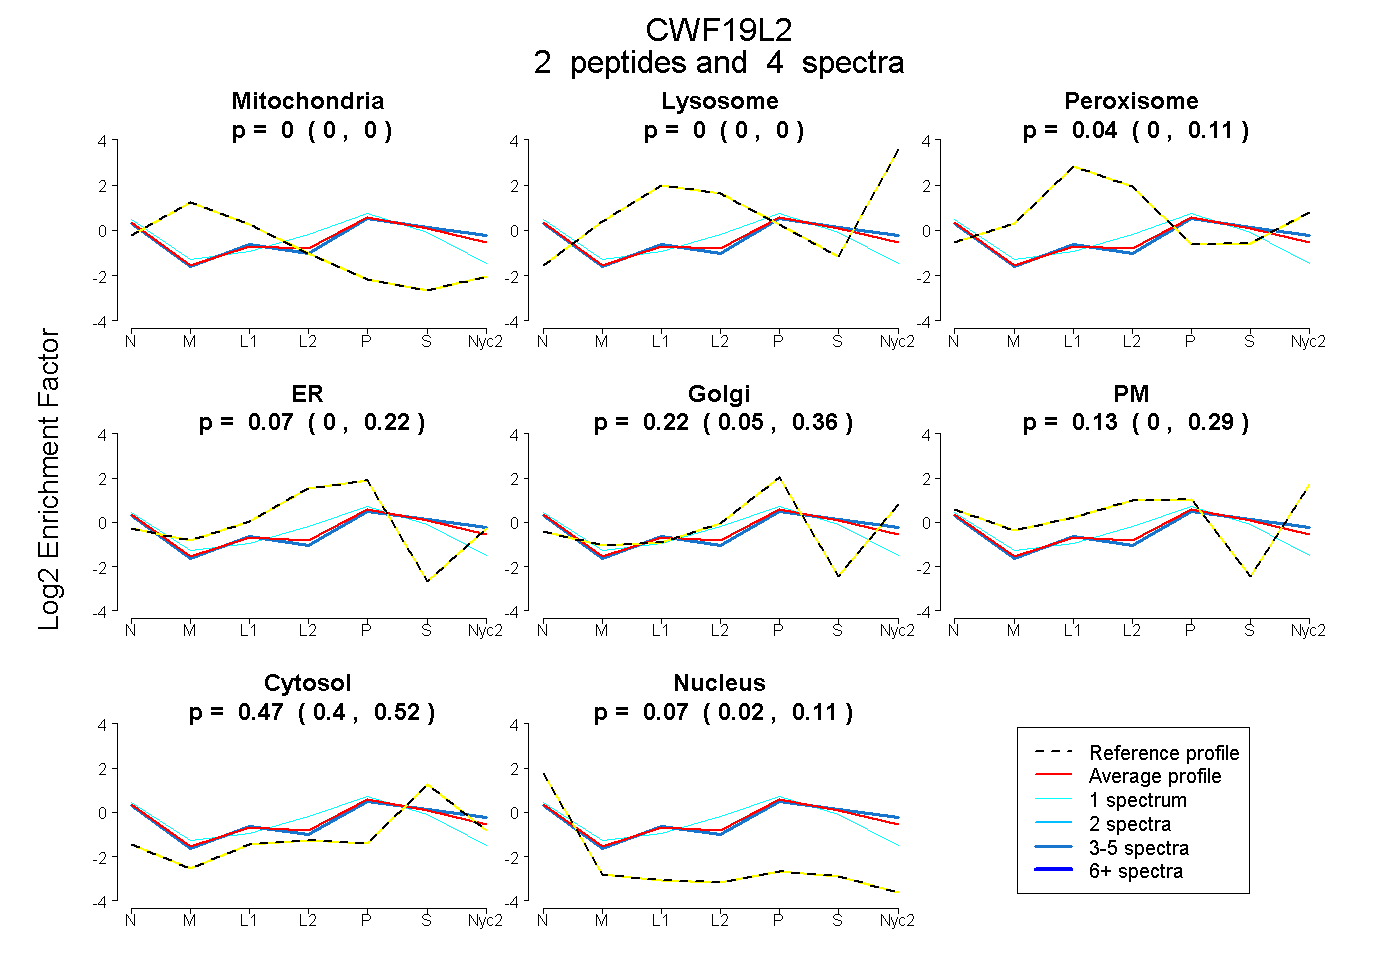
0.000 | 0.000
0.000 | 0.000
0.000 | 0.114
0.000 | 0.220
0.045 | 0.364
0.000 | 0.286
0.397 | 0.521
0.022 | 0.110
| Plot | Mito | Lyso | Perox | ER | Golgi | PM | Cytosol | Nucleus | |||||
| Expt A |
2 peptides |
4 spectra |
|
0.000 0.000 | 0.000 |
0.000 0.000 | 0.000 |
0.040 0.000 | 0.114 |
0.067 0.000 | 0.220 |
0.224 0.045 | 0.364 |
0.134 0.000 | 0.286 |
0.466 0.397 | 0.521 |
0.069 0.022 | 0.110 |
| 1 spectrum, ESFEDQR | 0.000 | 0.000 | 0.000 | 0.475 | 0.000 | 0.000 | 0.415 | 0.110 | ||
| 3 spectra, NFEDIVAEK | 0.000 | 0.000 | 0.008 | 0.000 | 0.210 | 0.232 | 0.506 | 0.044 |