16
16peptides
spectra
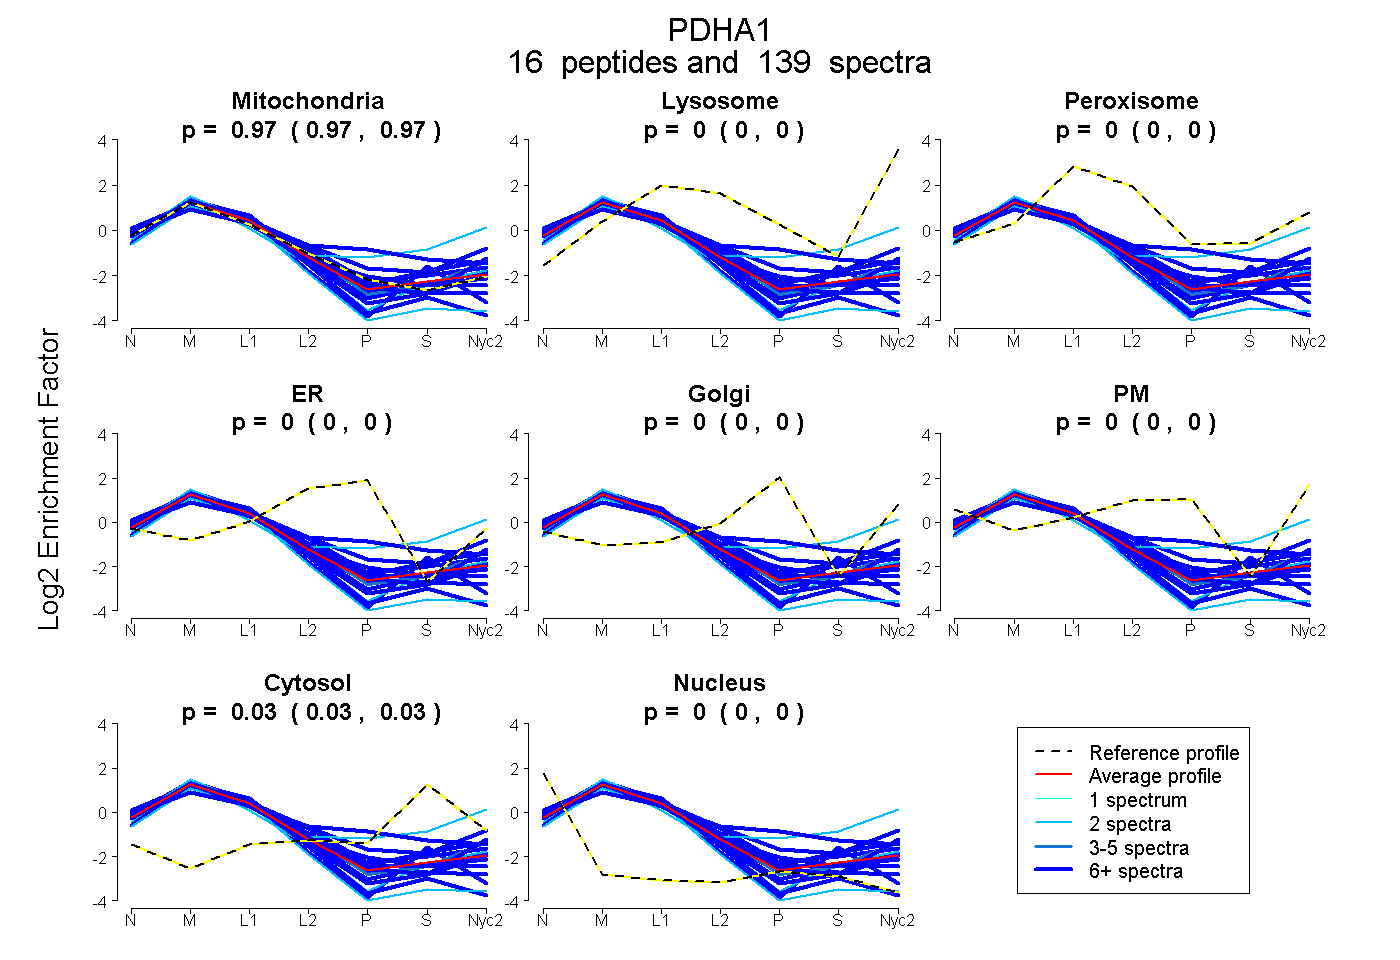
0.967 | 0.972
0.000 | 0.000
0.000 | 0.000
0.000 | 0.000
0.000 | 0.000
0.000 | 0.000
0.027 | 0.033
0.000 | 0.000
12peptides
spectra
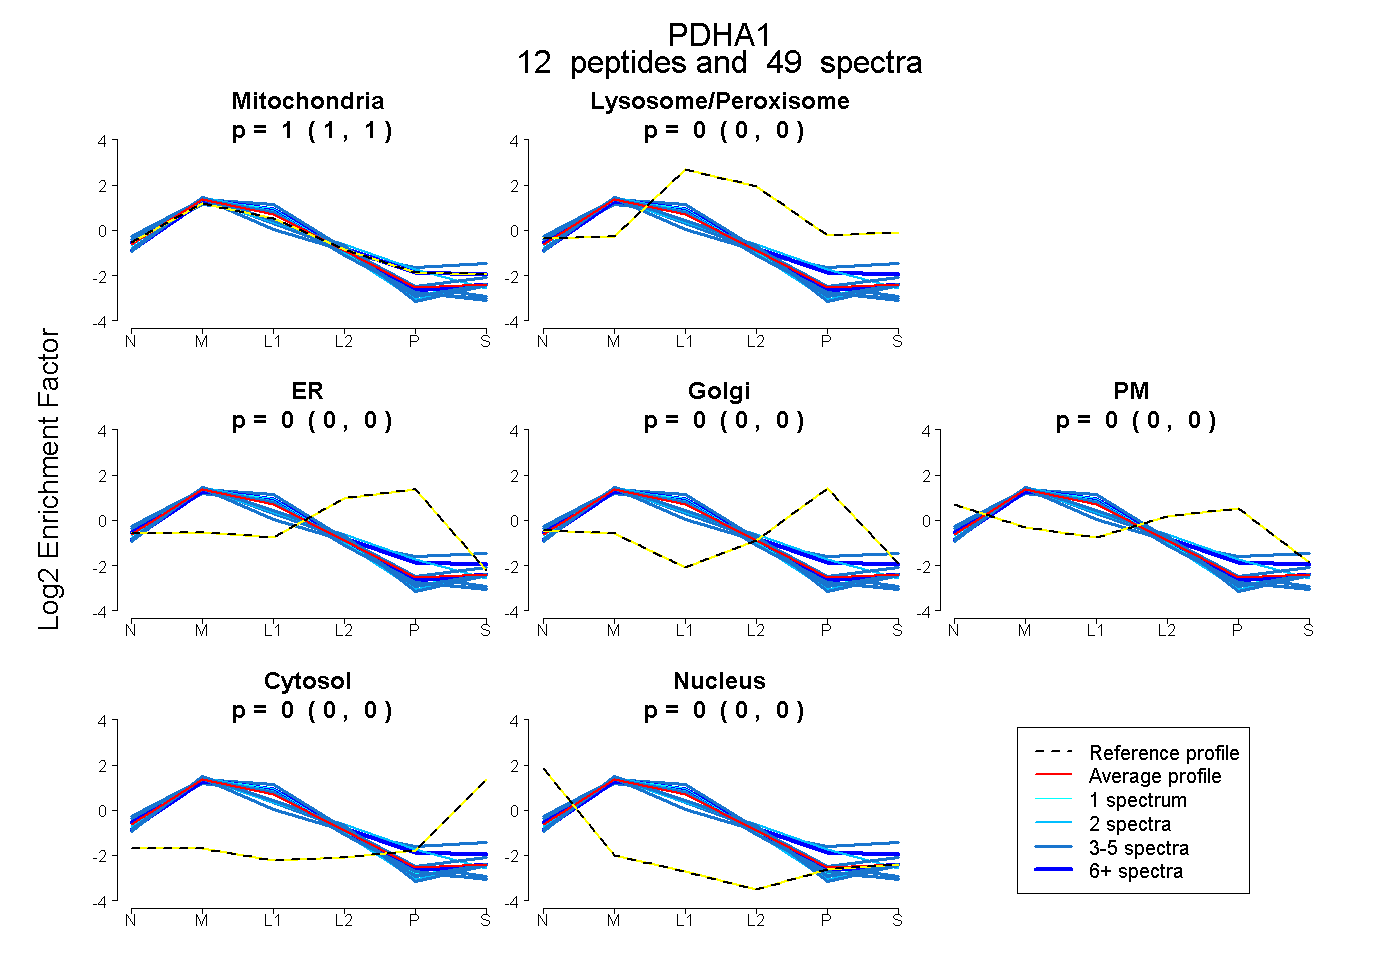
1.000 | 1.000
0.000 | 0.000
0.000 | 0.000
0.000 | 0.000
0.000 | 0.000
0.000 | 0.000
0.000 | 0.000
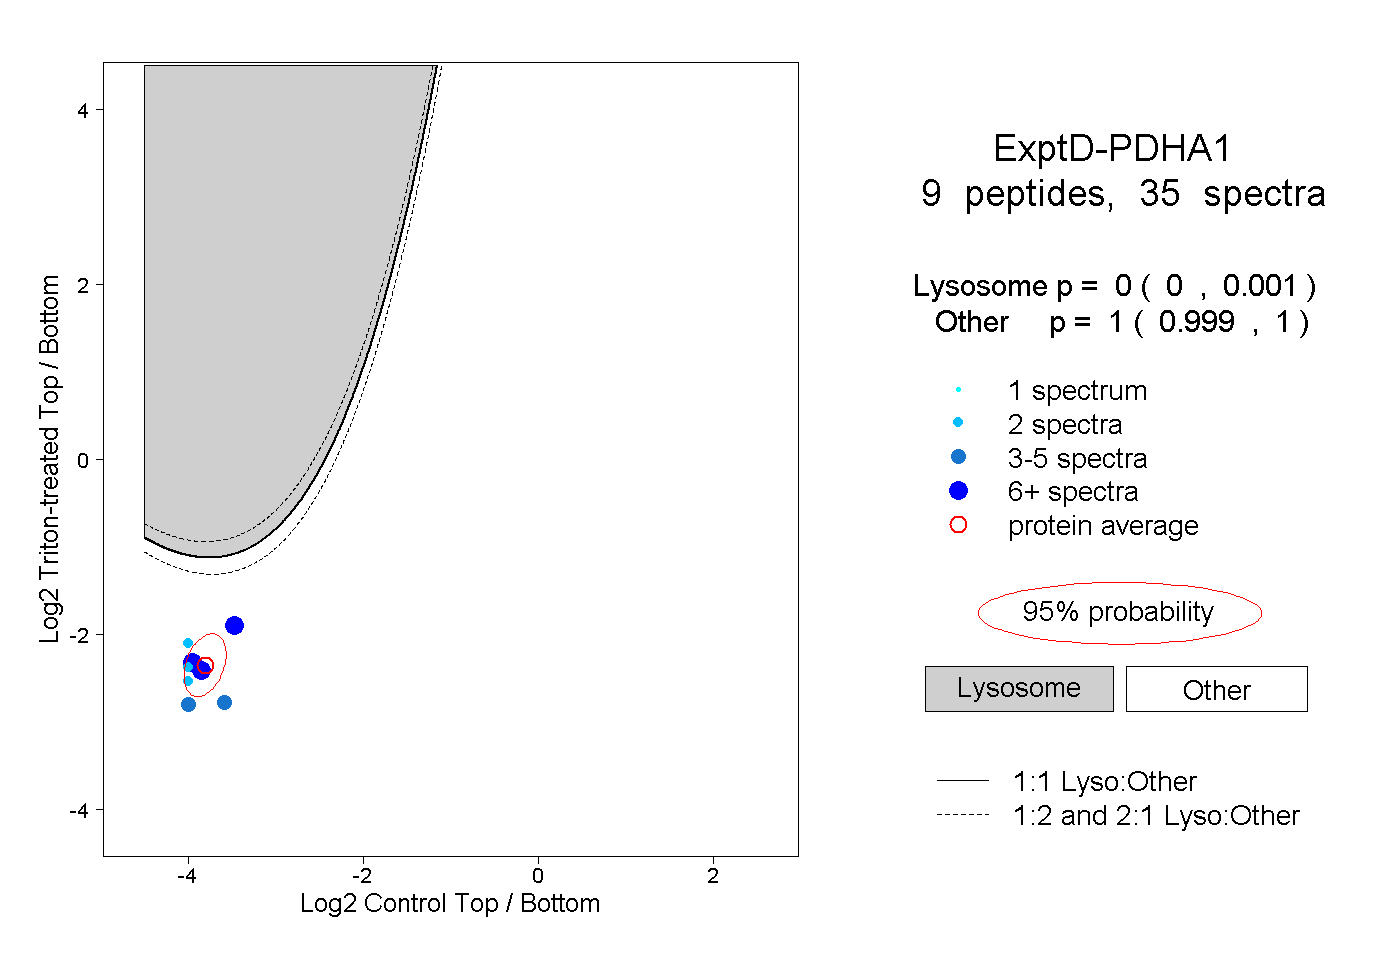
18peptides
spectra
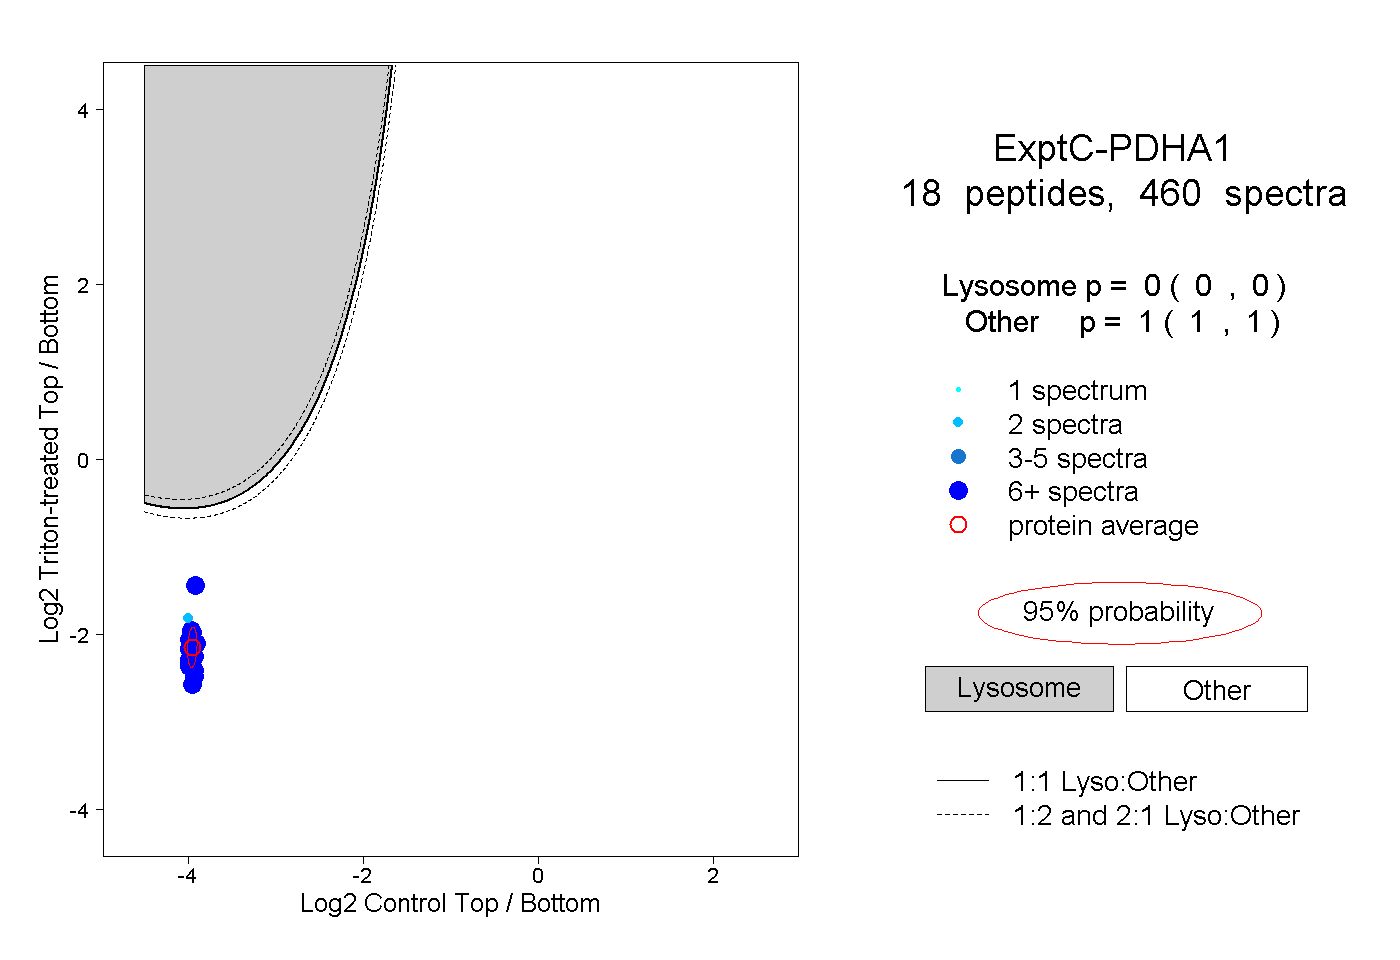
0.000 | 0.000
1.000 | 1.000