 16
16peptides
spectra
0.967 | 0.972
0.000 | 0.000
0.000 | 0.000
0.000 | 0.000
0.000 | 0.000
0.000 | 0.000
0.027 | 0.033
0.000 | 0.000
| Plot | Mito | Lyso | Perox | ER | Golgi | PM | Cytosol | Nucleus | |||||
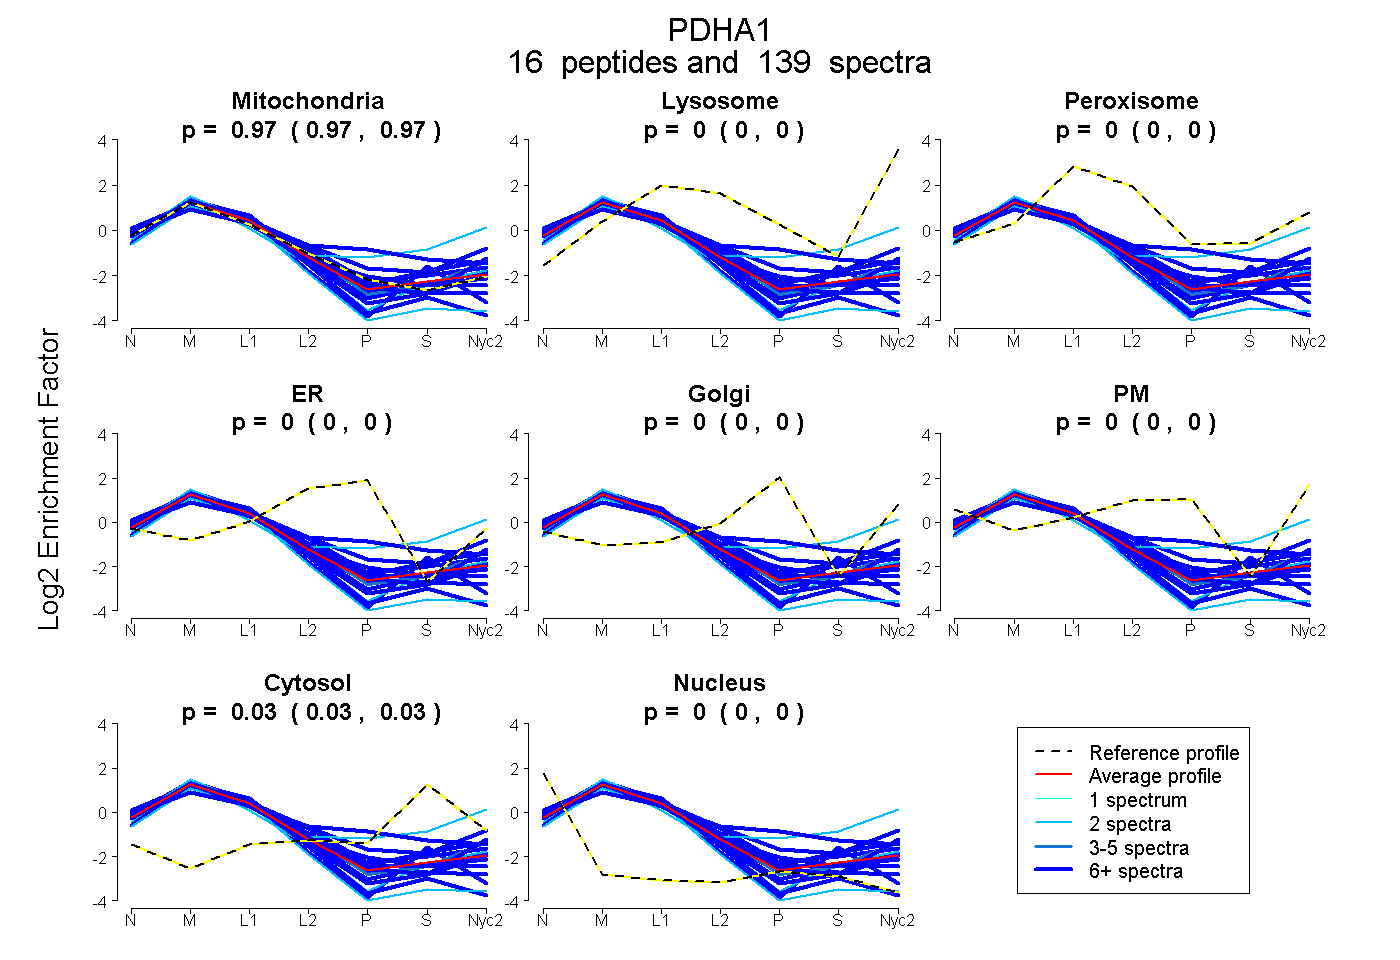
| Expt A |
16 peptides |
139 spectra |
|
0.970 0.967 | 0.972 |
0.000 0.000 | 0.000 |
0.000 0.000 | 0.000 |
0.000 0.000 | 0.000 |
0.000 0.000 | 0.000 |
0.000 0.000 | 0.000 |
0.030 0.027 | 0.033 |
0.000 0.000 | 0.000 |
| 6 spectra, LPCIFICENNR | 0.914 | 0.000 | 0.000 | 0.000 | 0.000 | 0.000 | 0.000 | 0.086 | ||
| 13 spectra, MMQTVR | 0.833 | 0.058 | 0.036 | 0.000 | 0.000 | 0.000 | 0.073 | 0.000 | ||
| 11 spectra, YGMGTSVER | 0.942 | 0.058 | 0.000 | 0.000 | 0.000 | 0.000 | 0.000 | 0.000 | ||
| 5 spectra, GDFIPGLR | 0.948 | 0.052 | 0.000 | 0.000 | 0.000 | 0.000 | 0.000 | 0.000 | ||
| 6 spectra, EEIQEVR | 0.931 | 0.000 | 0.000 | 0.000 | 0.000 | 0.000 | 0.000 | 0.069 | ||
| 2 spectra, SDPIMLLK | 0.900 | 0.000 | 0.000 | 0.000 | 0.000 | 0.000 | 0.000 | 0.100 | ||
| 23 spectra, AHGFTFTR | 0.854 | 0.000 | 0.095 | 0.000 | 0.000 | 0.000 | 0.051 | 0.000 | ||
| 10 spectra, AILAELTGR | 0.994 | 0.000 | 0.000 | 0.000 | 0.000 | 0.000 | 0.004 | 0.002 | ||
| 16 spectra, FAAAYCR | 0.994 | 0.000 | 0.000 | 0.000 | 0.000 | 0.000 | 0.000 | 0.006 | ||
| 6 spectra, GANQWIK | 0.738 | 0.128 | 0.041 | 0.000 | 0.000 | 0.043 | 0.049 | 0.000 | ||
| 8 spectra, YHGHSMSDPGVSYR | 0.618 | 0.000 | 0.148 | 0.017 | 0.099 | 0.000 | 0.119 | 0.000 | ||
| 7 spectra, GPILMELQTYR | 1.000 | 0.000 | 0.000 | 0.000 | 0.000 | 0.000 | 0.000 | 0.000 | ||
| 2 spectra, MVNSNLASVEELK | 0.519 | 0.283 | 0.000 | 0.000 | 0.000 | 0.000 | 0.198 | 0.000 | ||
| 2 spectra, EIDVEVR | 0.973 | 0.000 | 0.000 | 0.000 | 0.000 | 0.000 | 0.016 | 0.011 | ||
| 14 spectra, VDGMDILCVR | 0.982 | 0.000 | 0.000 | 0.000 | 0.000 | 0.000 | 0.013 | 0.005 | ||
| 8 spectra, AAASTDYYK | 0.918 | 0.000 | 0.000 | 0.000 | 0.000 | 0.000 | 0.000 | 0.082 |
| Plot | Mito | Lyso or Perox | ER | Golgi | PM | Cytosol | Nucleus | ||||||
| Expt B |
12 peptides |
49 spectra |
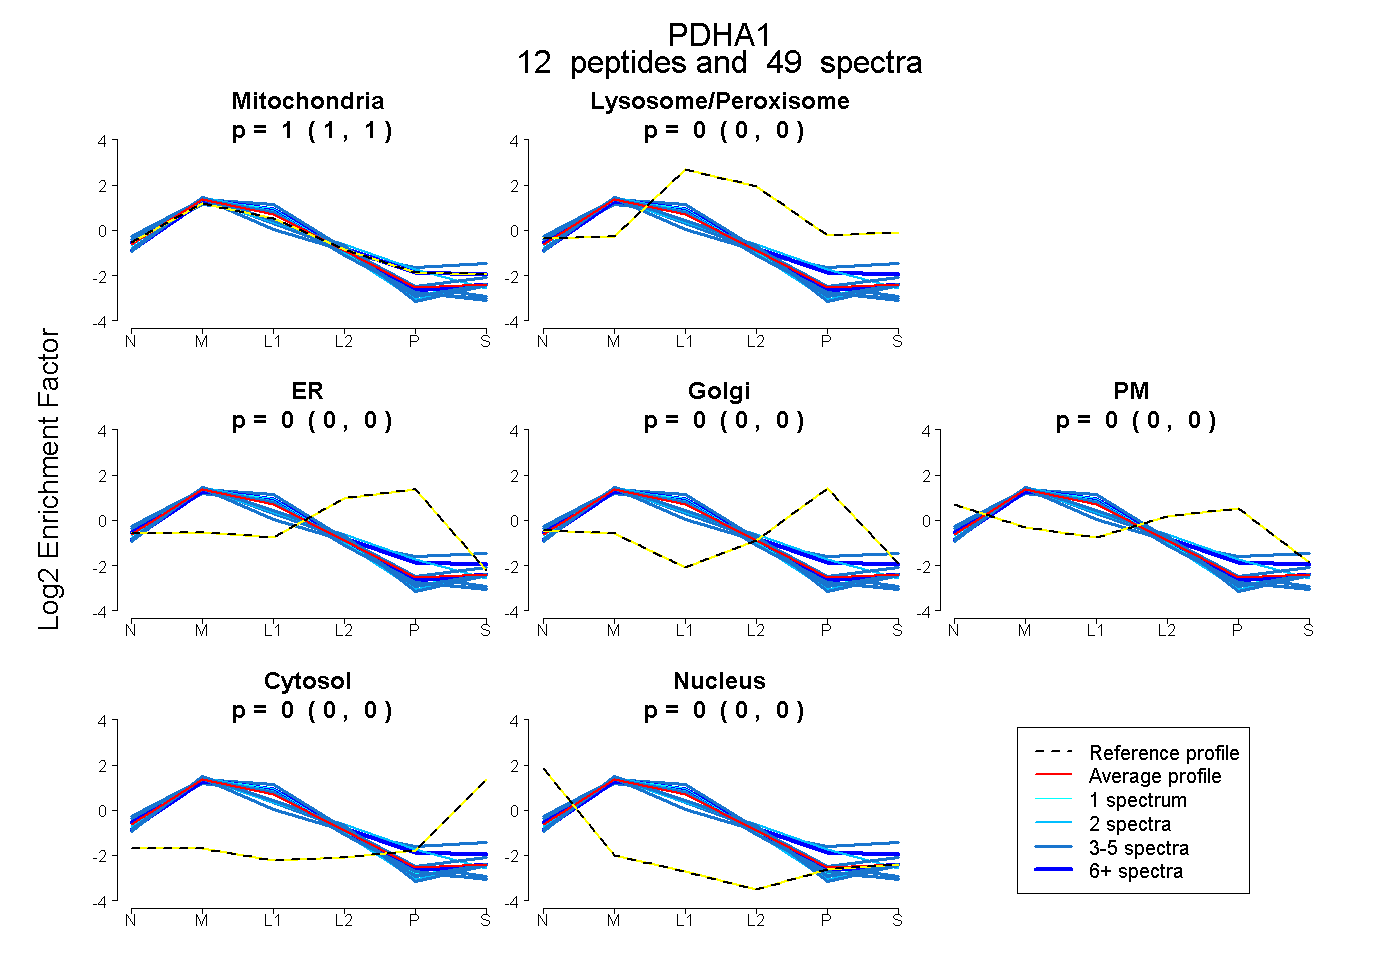 |
1.000 1.000 | 1.000 |
0.000 0.000 | 0.000 |
0.000 0.000 | 0.000 |
0.000 0.000 | 0.000 |
0.000 0.000 | 0.000 |
0.000 0.000 | 0.000 |
0.000 0.000 | 0.000 |
|||
| Plot | Lyso | Other | |||||||||||
| Expt C |
18 peptides |
460 spectra |
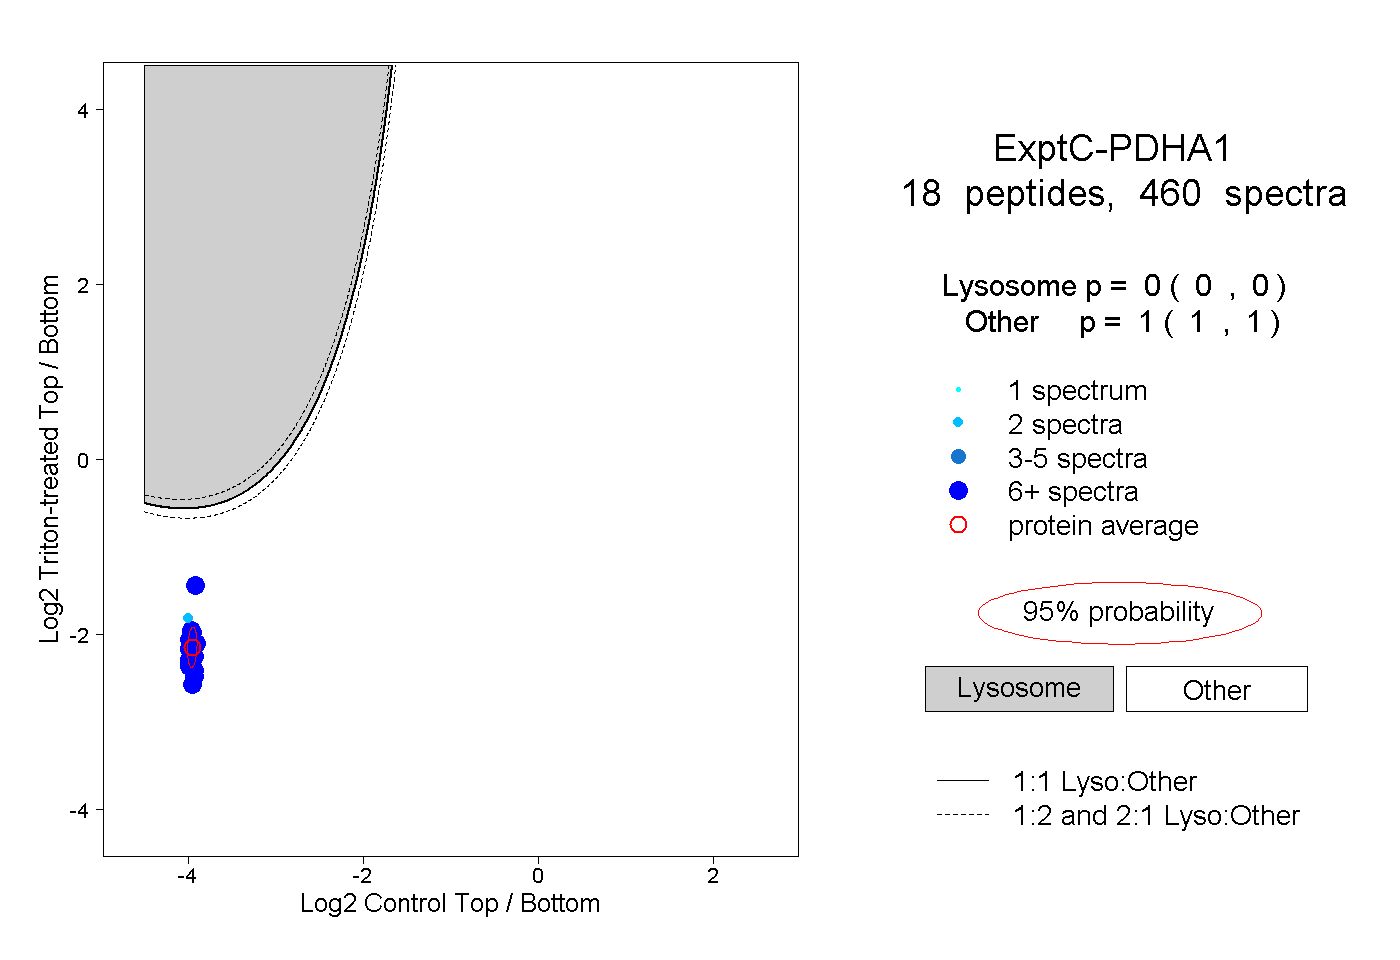 |
0.000 0.000 | 0.000 |
1.000 1.000 | 1.000 |
||||||||
| Plot | Lyso | Other | |||||||||||
| Expt D |
9 peptides |
35 spectra |
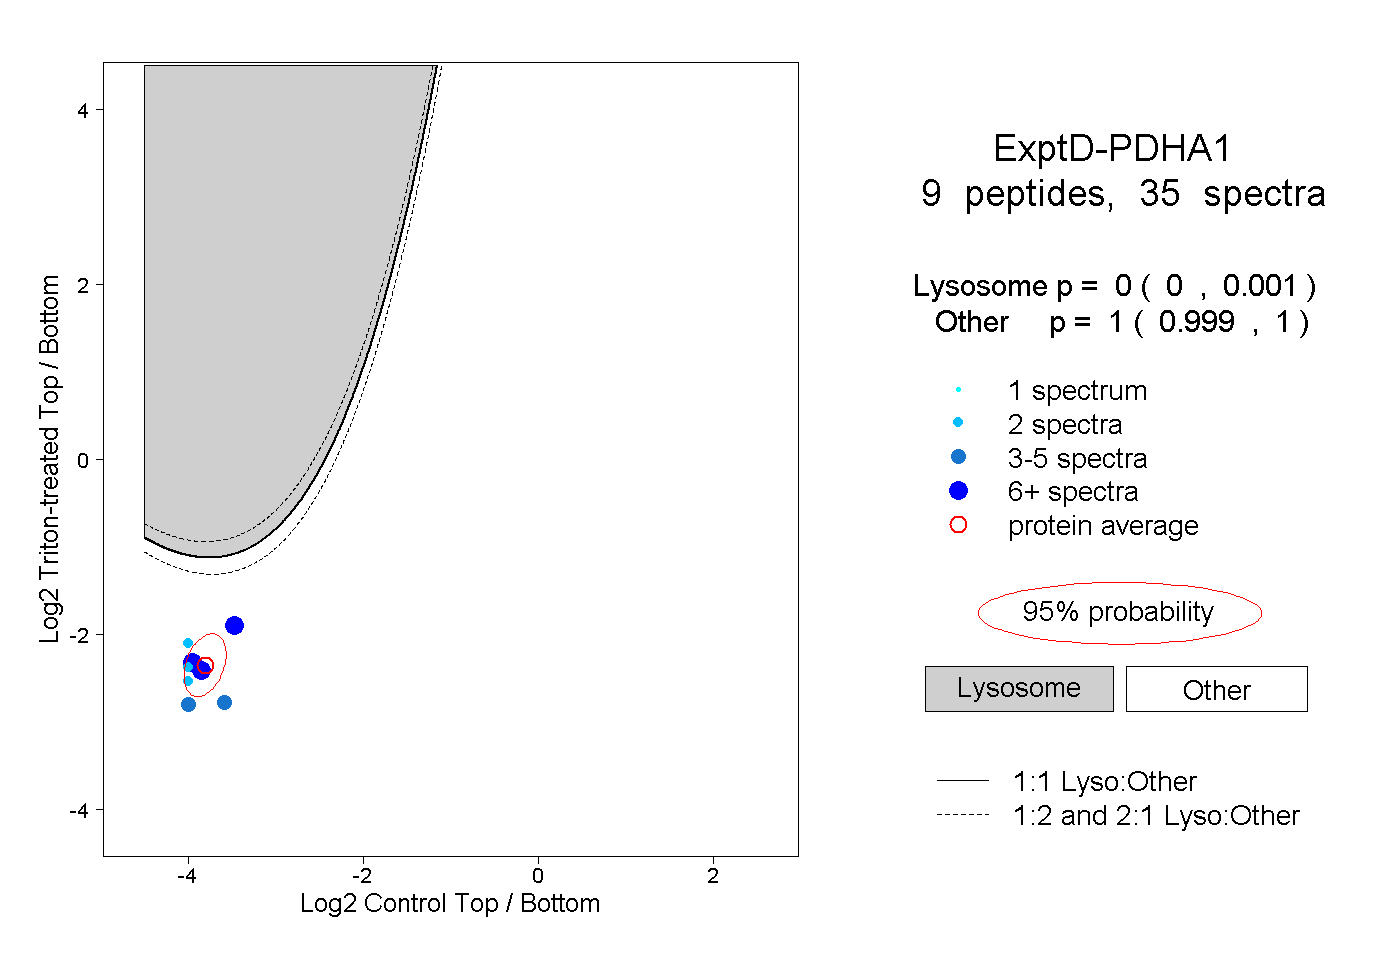 |
0.000 0.000 | 0.001 |
1.000 0.999 | 1.000 |