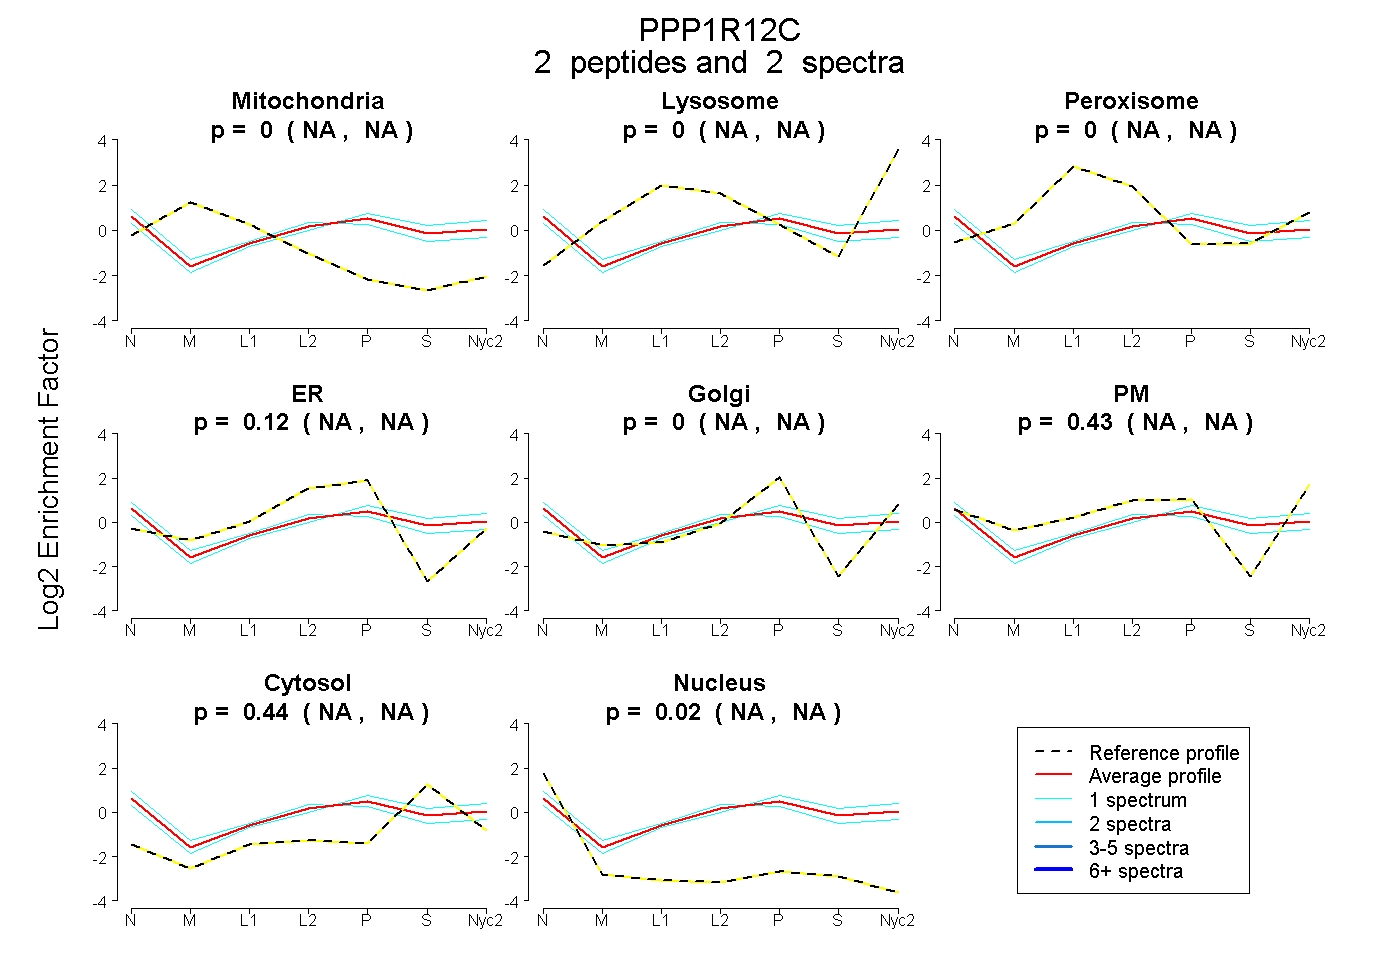
 2
2peptides
spectra
NA | NA
NA | NA
NA | NA
NA | NA
NA | NA
NA | NA
NA | NA
NA | NA
| Plot | Mito | Lyso | Perox | ER | Golgi | PM | Cytosol | Nucleus | |||||
| Expt A |
2 peptides |
2 spectra |
|
0.000 NA | NA |
0.000 NA | NA |
0.000 NA | NA |
0.121 NA | NA |
0.000 NA | NA |
0.426 NA | NA |
0.436 NA | NA |
0.017 NA | NA |
| 1 spectrum, AEEELLLHDTR | 0.000 | 0.000 | 0.099 | 0.159 | 0.000 | 0.339 | 0.290 | 0.113 | ||
| 1 spectrum, TGSSGALGPSER | 0.000 | 0.000 | 0.000 | 0.000 | 0.107 | 0.412 | 0.481 | 0.000 |
| Plot | Lyso | Other | |||||||||||
| Expt C |
4 peptides |
6 spectra |
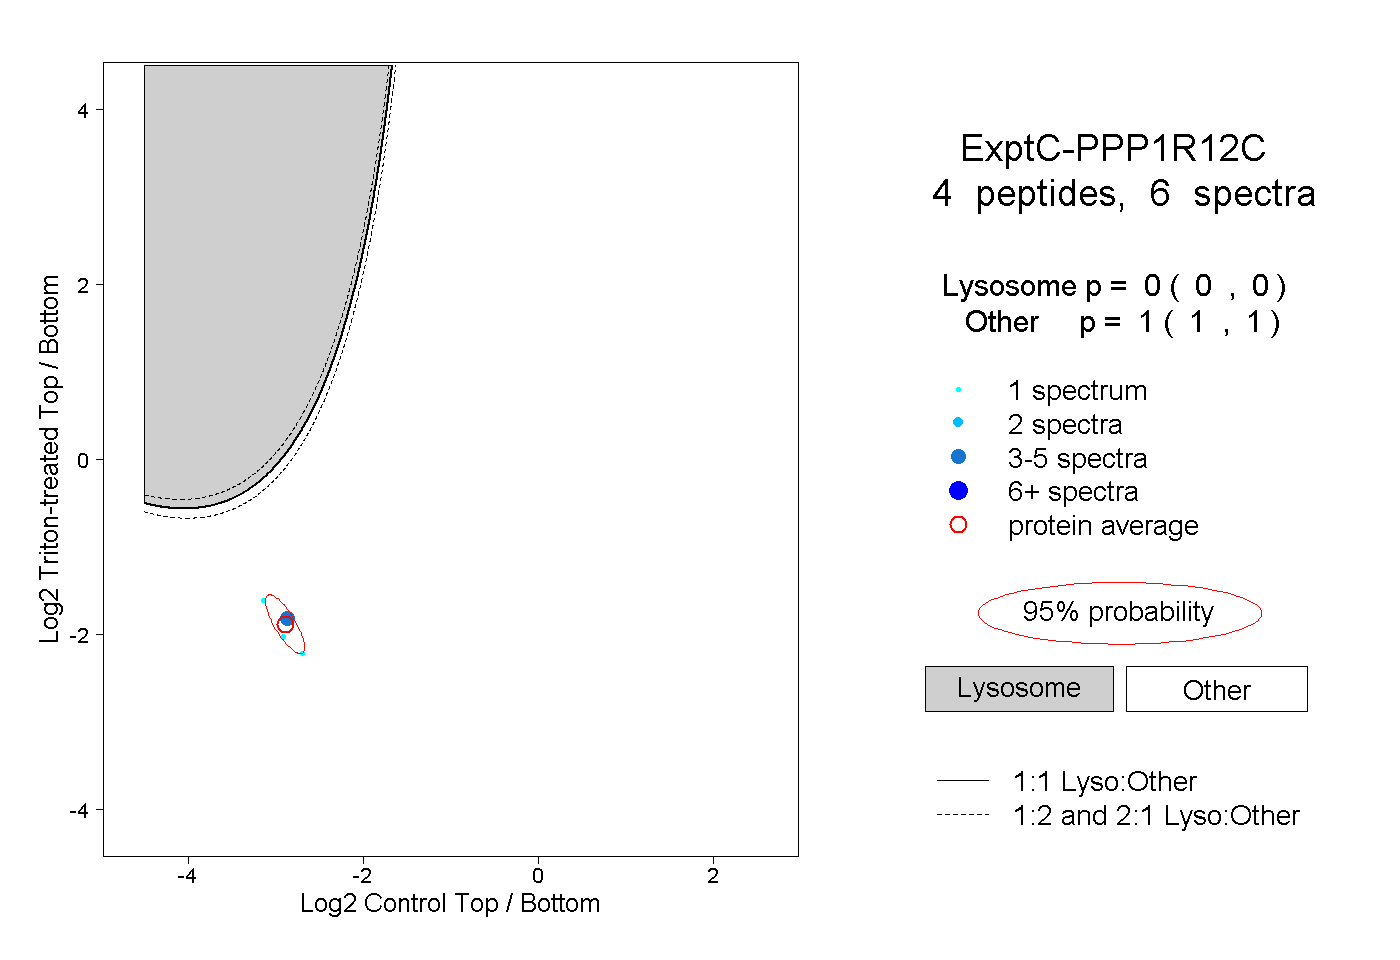 |
0.000 0.000 | 0.000 |
1.000 1.000 | 1.000 |