21
21peptides
spectra
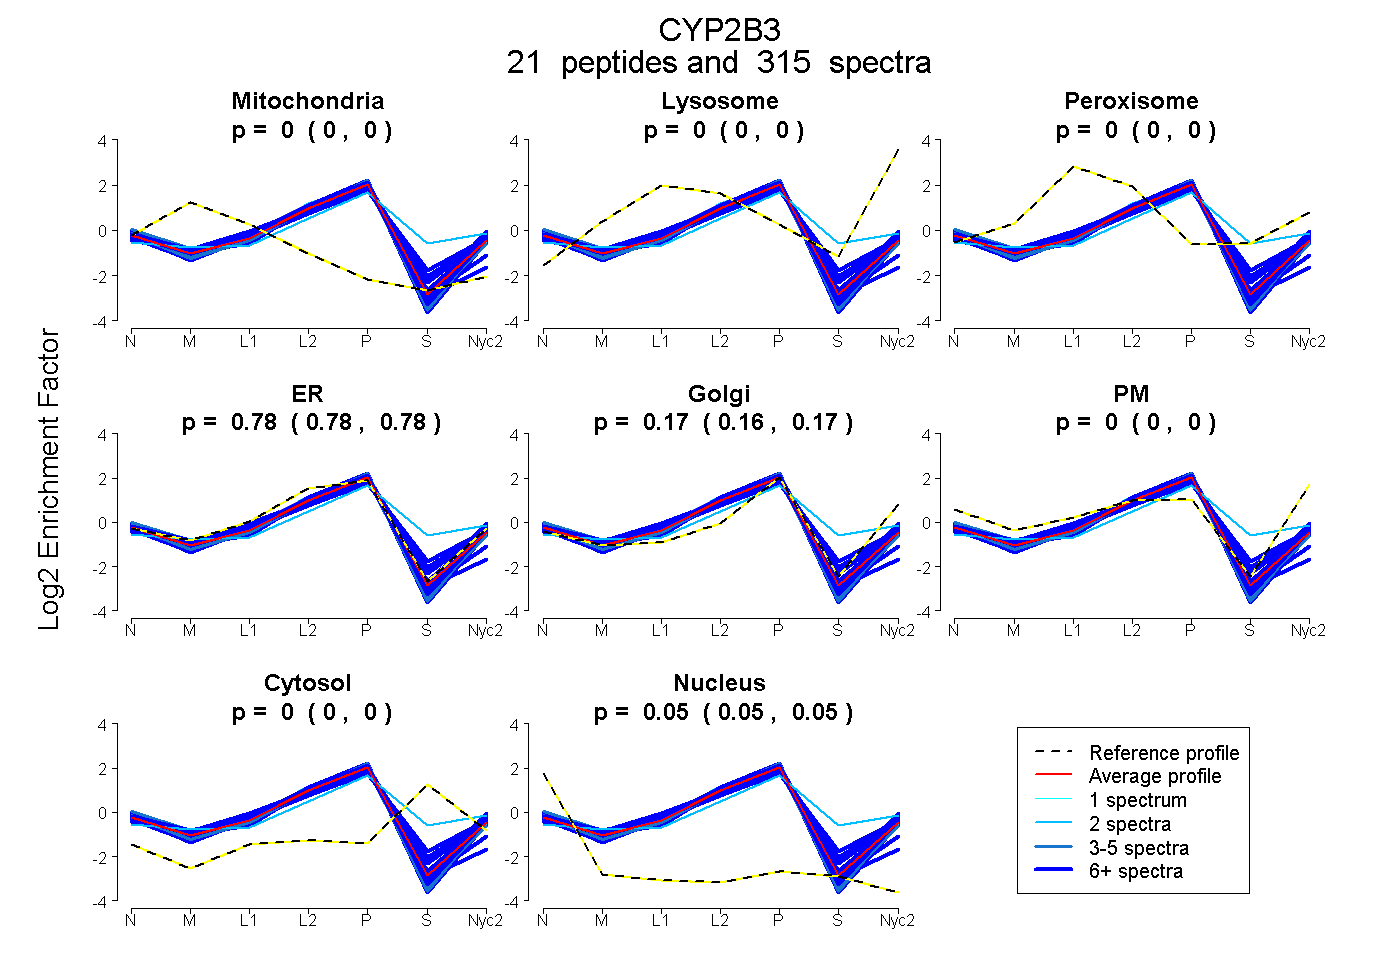
0.000 | 0.000
0.000 | 0.000
0.000 | 0.000
0.780 | 0.784
0.164 | 0.170
0.000 | 0.000
0.000 | 0.000
0.049 | 0.051
21peptides
spectra
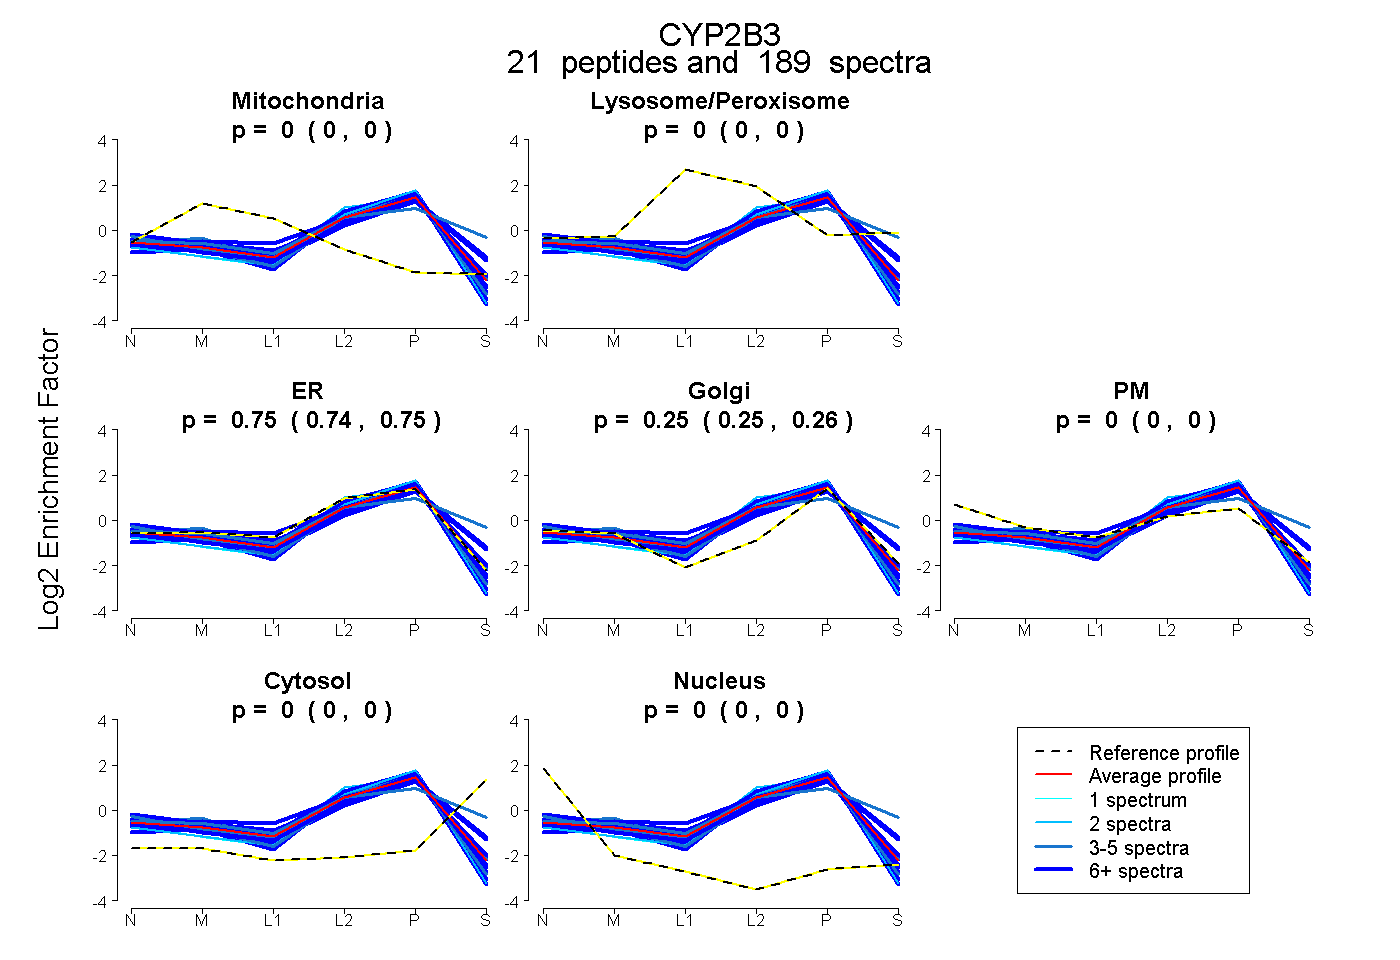
0.000 | 0.000
0.000 | 0.000
0.742 | 0.749
0.251 | 0.258
0.000 | 0.000
0.000 | 0.000
0.000 | 0.000
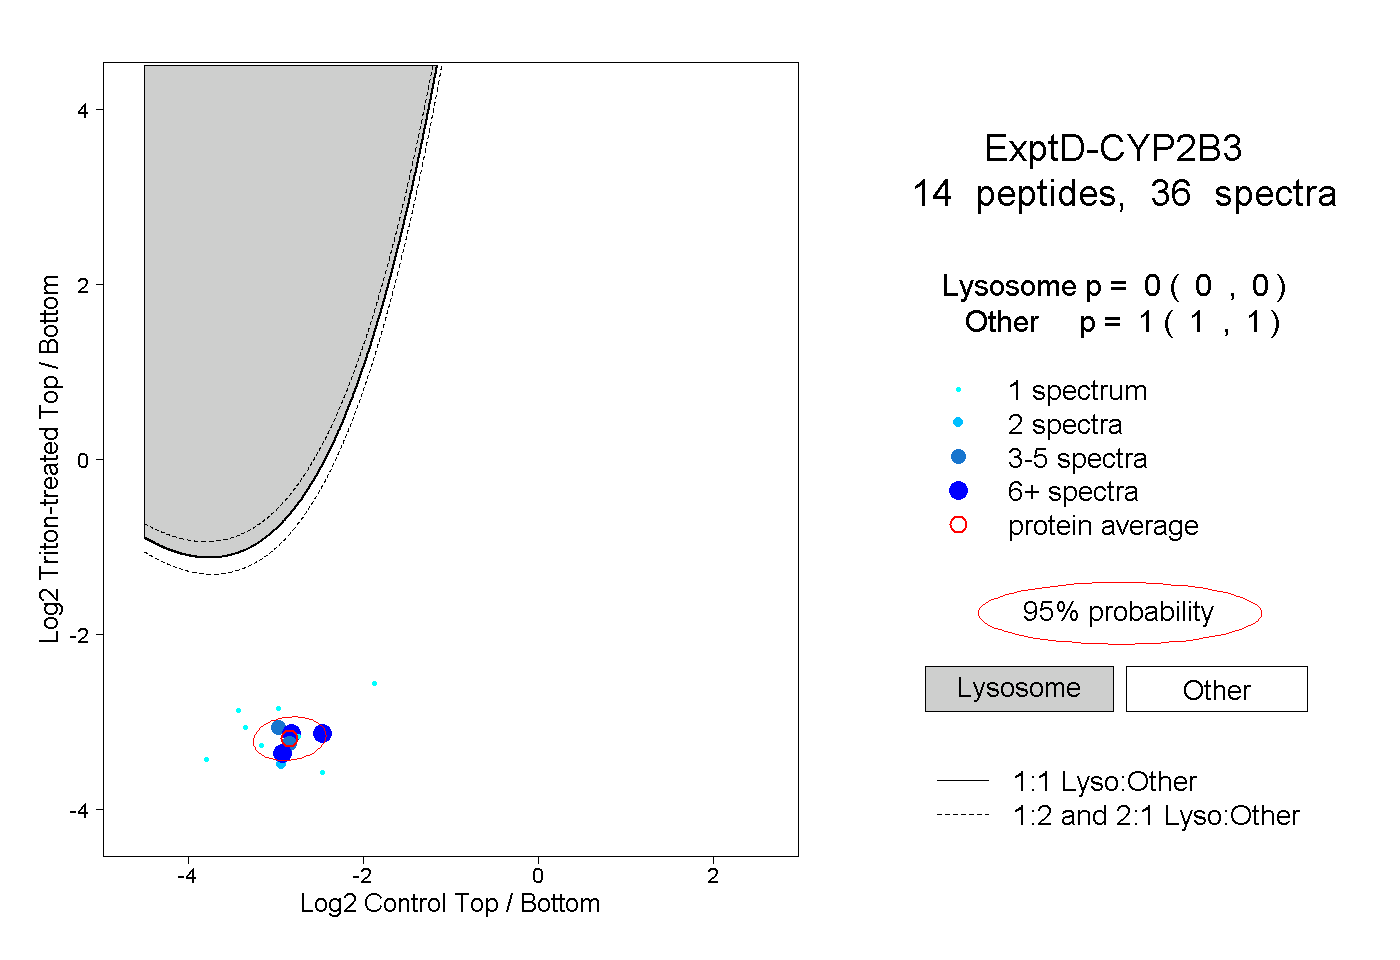
21peptides
spectra
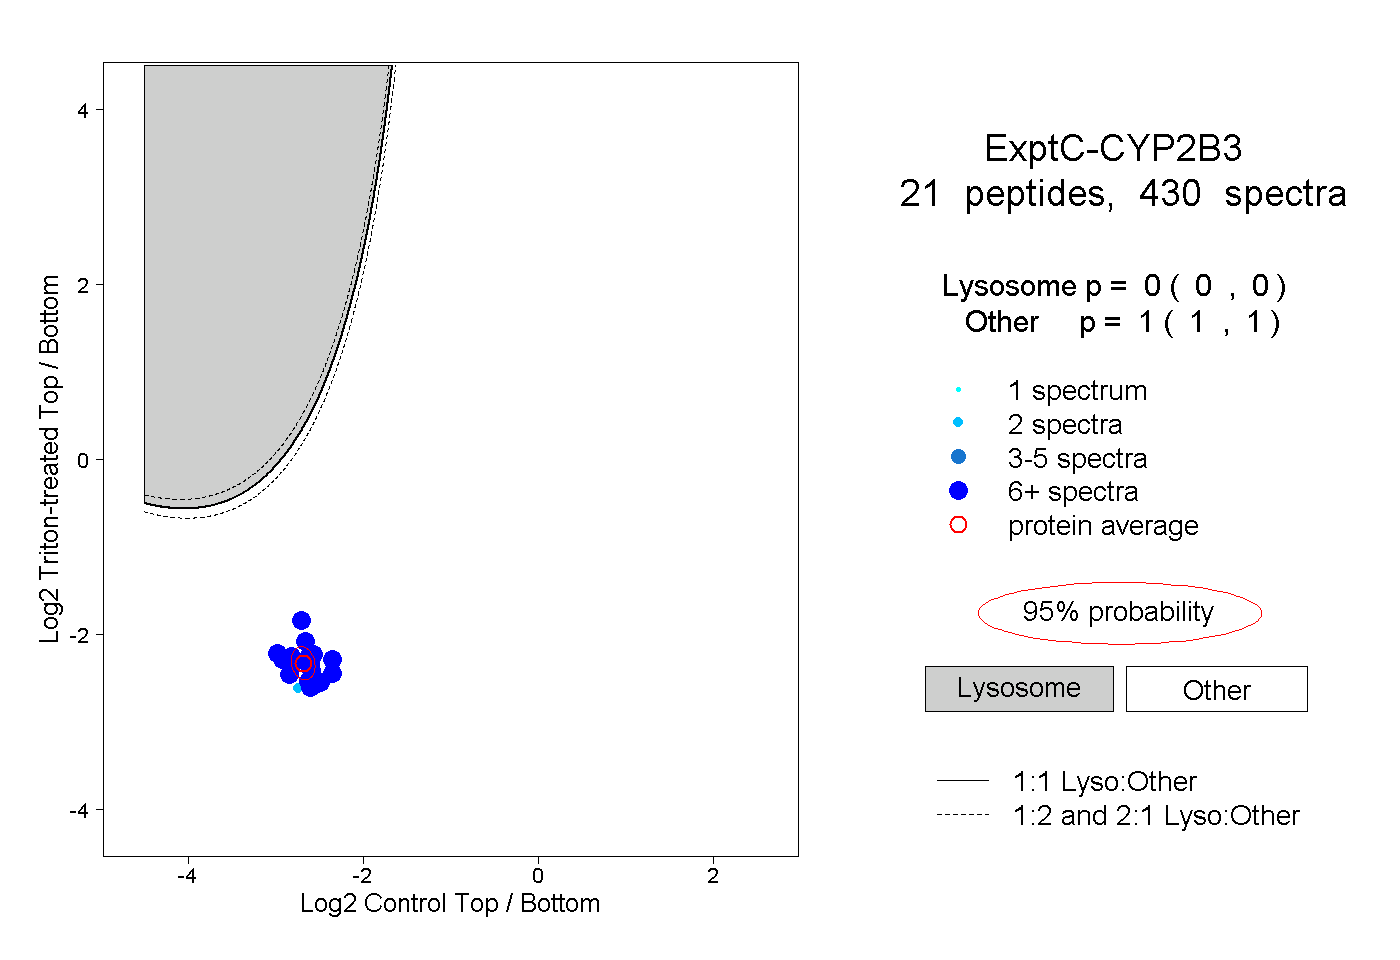
0.000 | 0.000
1.000 | 1.000