 6
6peptides
spectra
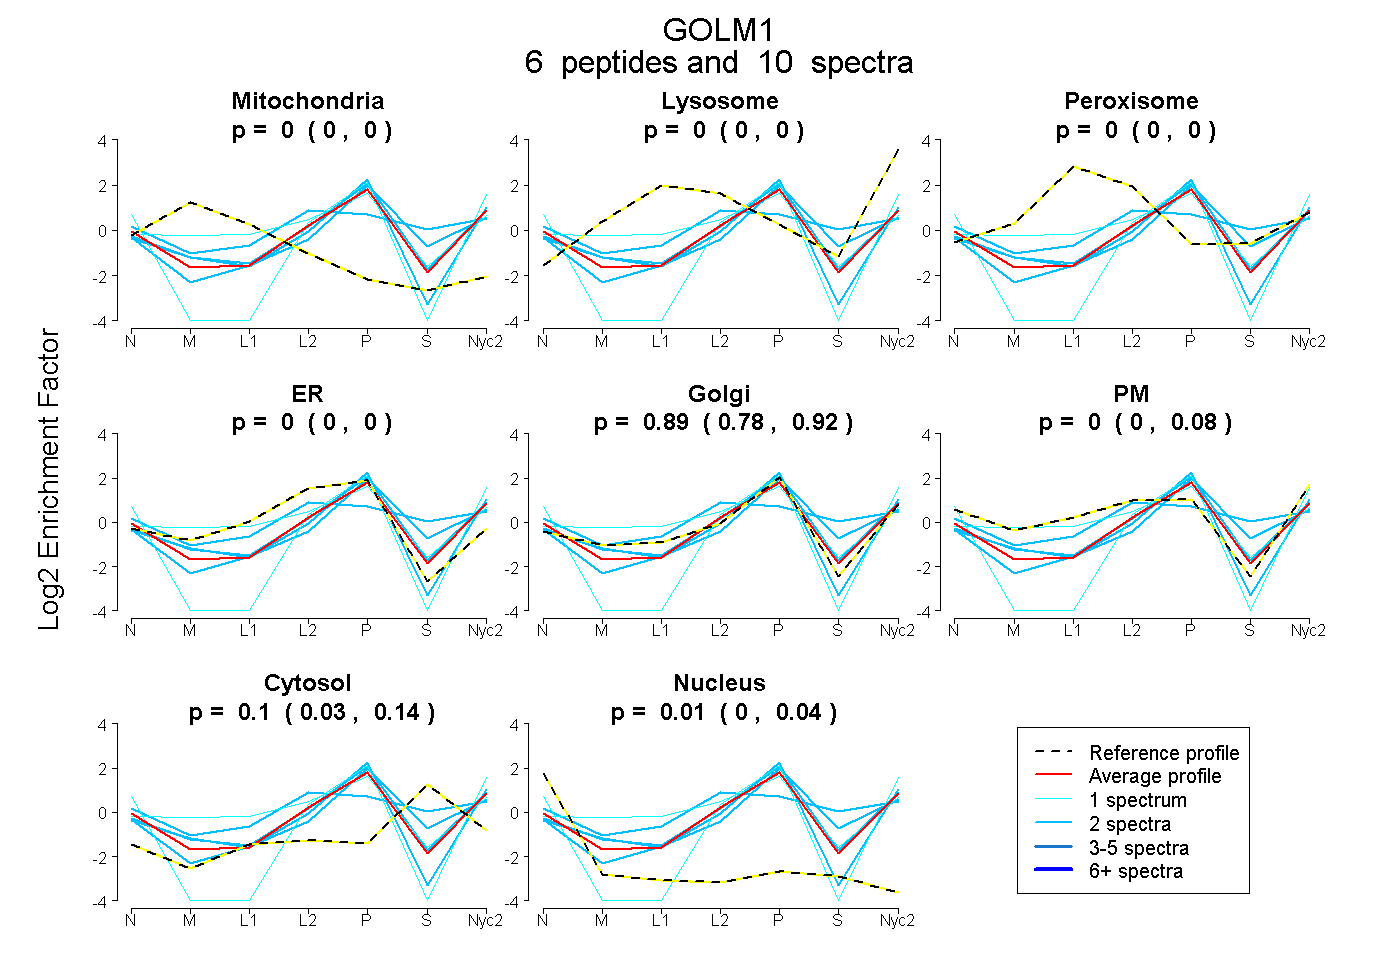
0.000 | 0.000
0.000 | 0.000
0.000 | 0.000
0.000 | 0.000
0.781 | 0.924
0.000 | 0.079
0.029 | 0.143
0.000 | 0.038
| Plot | Mito | Lyso | Perox | ER | Golgi | PM | Cytosol | Nucleus | |||||
| Expt A |
6 peptides |
10 spectra |
|
0.000 0.000 | 0.000 |
0.000 0.000 | 0.000 |
0.000 0.000 | 0.000 |
0.000 0.000 | 0.000 |
0.892 0.781 | 0.924 |
0.002 0.000 | 0.079 |
0.098 0.029 | 0.143 |
0.007 0.000 | 0.038 |
| 2 spectra, IEEVVR | 0.000 | 0.000 | 0.000 | 0.000 | 0.994 | 0.000 | 0.000 | 0.006 | ||
| 2 spectra, GGQELQR | 0.000 | 0.000 | 0.062 | 0.129 | 0.000 | 0.431 | 0.377 | 0.000 | ||
| 2 spectra, DQLVLR | 0.000 | 0.000 | 0.000 | 0.000 | 0.711 | 0.000 | 0.289 | 0.000 | ||
| 1 spectrum, NEFQGELQK | 0.005 | 0.000 | 0.234 | 0.020 | 0.725 | 0.016 | 0.000 | 0.000 | ||
| 2 spectra, LHQDEK | 0.000 | 0.000 | 0.000 | 0.000 | 0.923 | 0.000 | 0.077 | 0.000 | ||
| 1 spectrum, LQQDIFQFQK | 0.000 | 0.000 | 0.000 | 0.000 | 0.841 | 0.000 | 0.000 | 0.159 |
| Plot | Lyso | Other | |||||||||||
| Expt C |
4 peptides |
7 spectra |
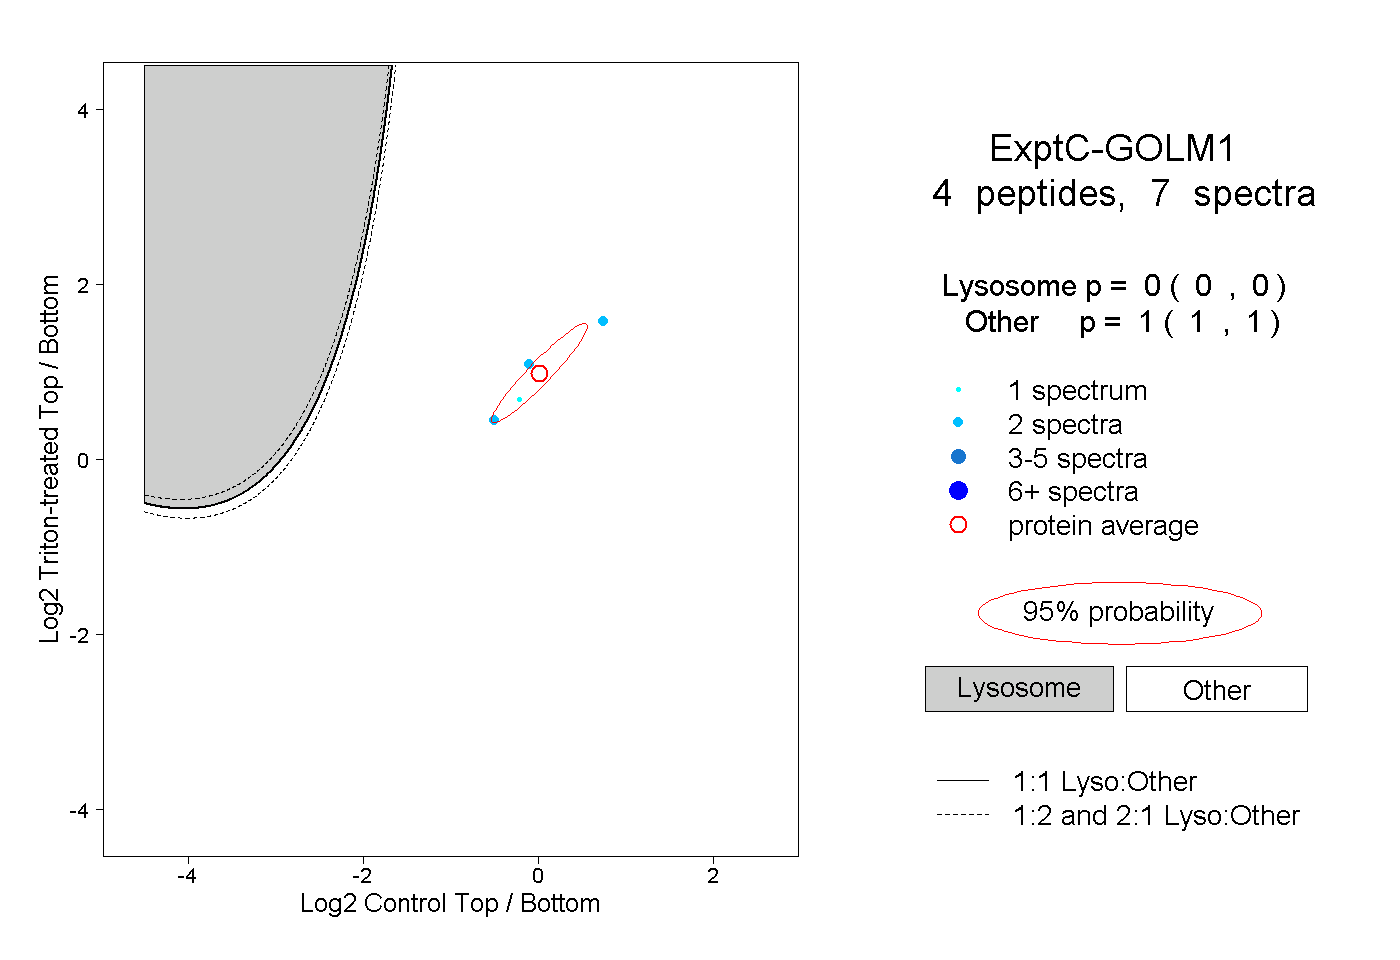 |
0.000 0.000 | 0.000 |
1.000 1.000 | 1.000 |
||||||||
| Plot | Lyso | Other | |||||||||||
| Expt D |
1 peptide |
1 spectrum |
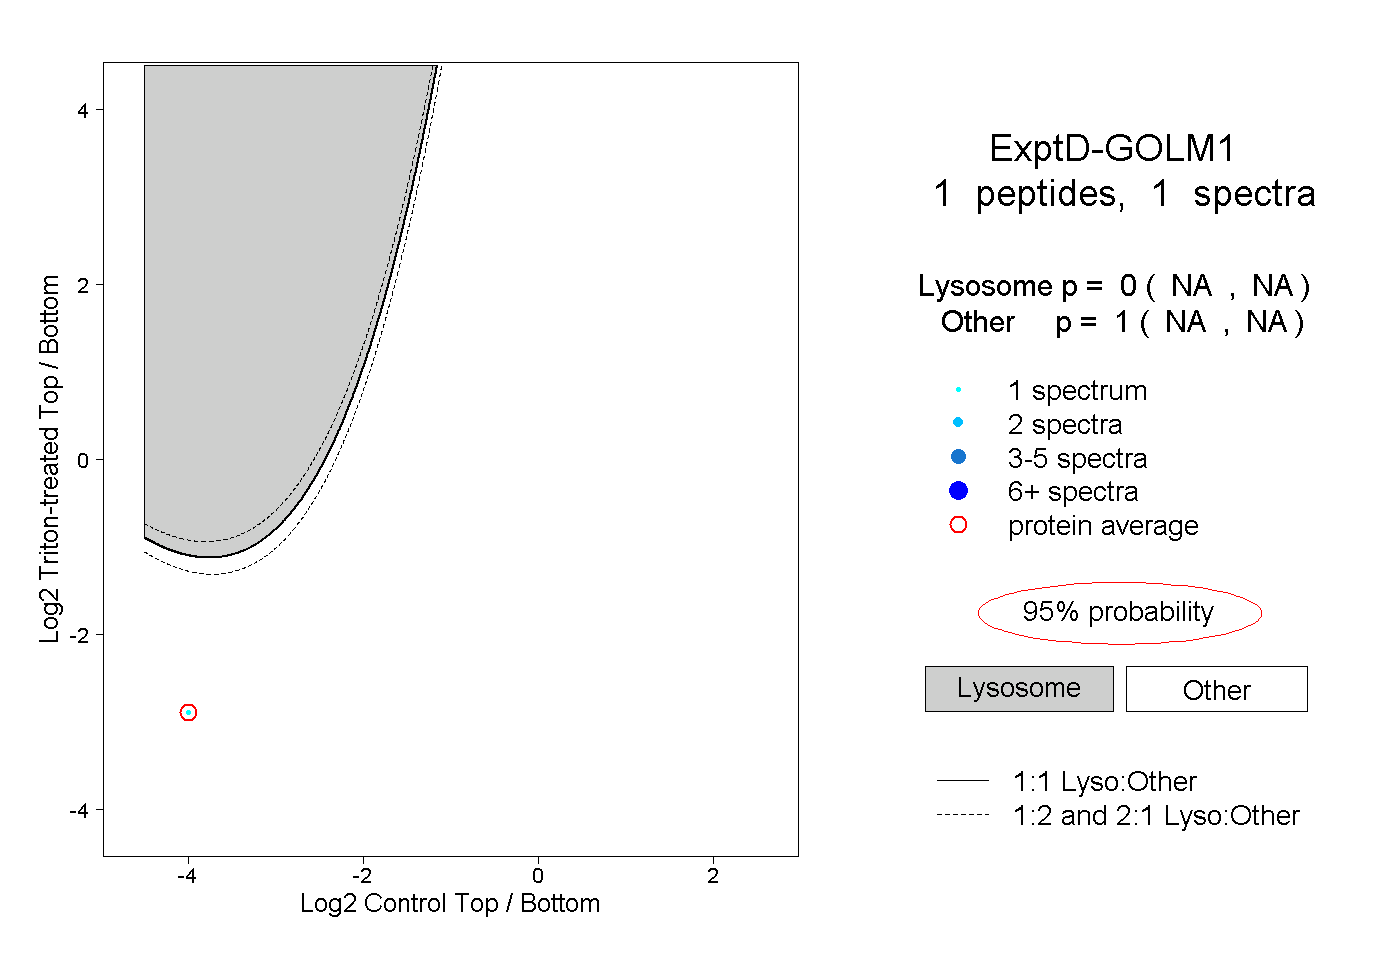 |
0.000 NA | NA |
1.000 NA | NA |