 4
4peptides
spectra
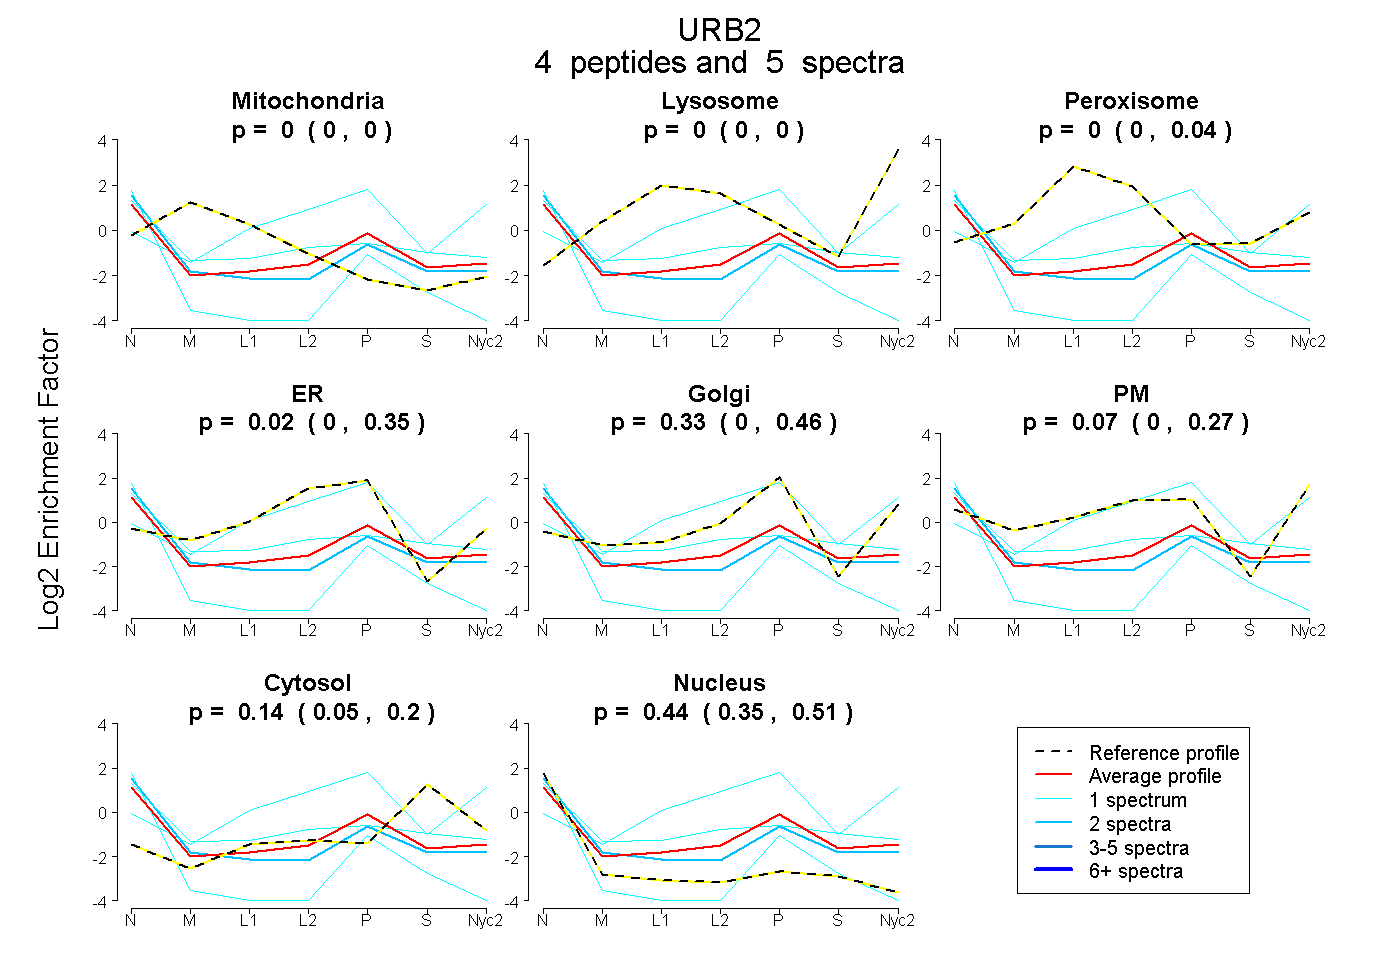
0.000 | 0.000
0.000 | 0.000
0.000 | 0.043
0.000 | 0.354
0.000 | 0.463
0.000 | 0.274
0.049 | 0.205
0.351 | 0.514
| Plot | Mito | Lyso | Perox | ER | Golgi | PM | Cytosol | Nucleus | |||||
| Expt A |
4 peptides |
5 spectra |
|
0.000 0.000 | 0.000 |
0.000 0.000 | 0.000 |
0.000 0.000 | 0.043 |
0.022 0.000 | 0.354 |
0.329 0.000 | 0.463 |
0.075 0.000 | 0.274 |
0.137 0.049 | 0.205 |
0.438 0.351 | 0.514 |
| 1 spectrum, VGSEGVEPR | 0.000 | 0.000 | 0.102 | 0.018 | 0.000 | 0.305 | 0.205 | 0.370 | ||
| 1 spectrum, TLPTSK | 0.000 | 0.147 | 0.000 | 0.255 | 0.260 | 0.202 | 0.137 | 0.000 | ||
| 2 spectra, ASLLWR | 0.000 | 0.000 | 0.000 | 0.000 | 0.231 | 0.113 | 0.087 | 0.569 | ||
| 1 spectrum, LQQQQANPR | 0.000 | 0.000 | 0.000 | 0.000 | 0.001 | 0.000 | 0.000 | 0.999 |
| Plot | Lyso | Other | |||||||||||
| Expt C |
1 peptide |
1 spectrum |
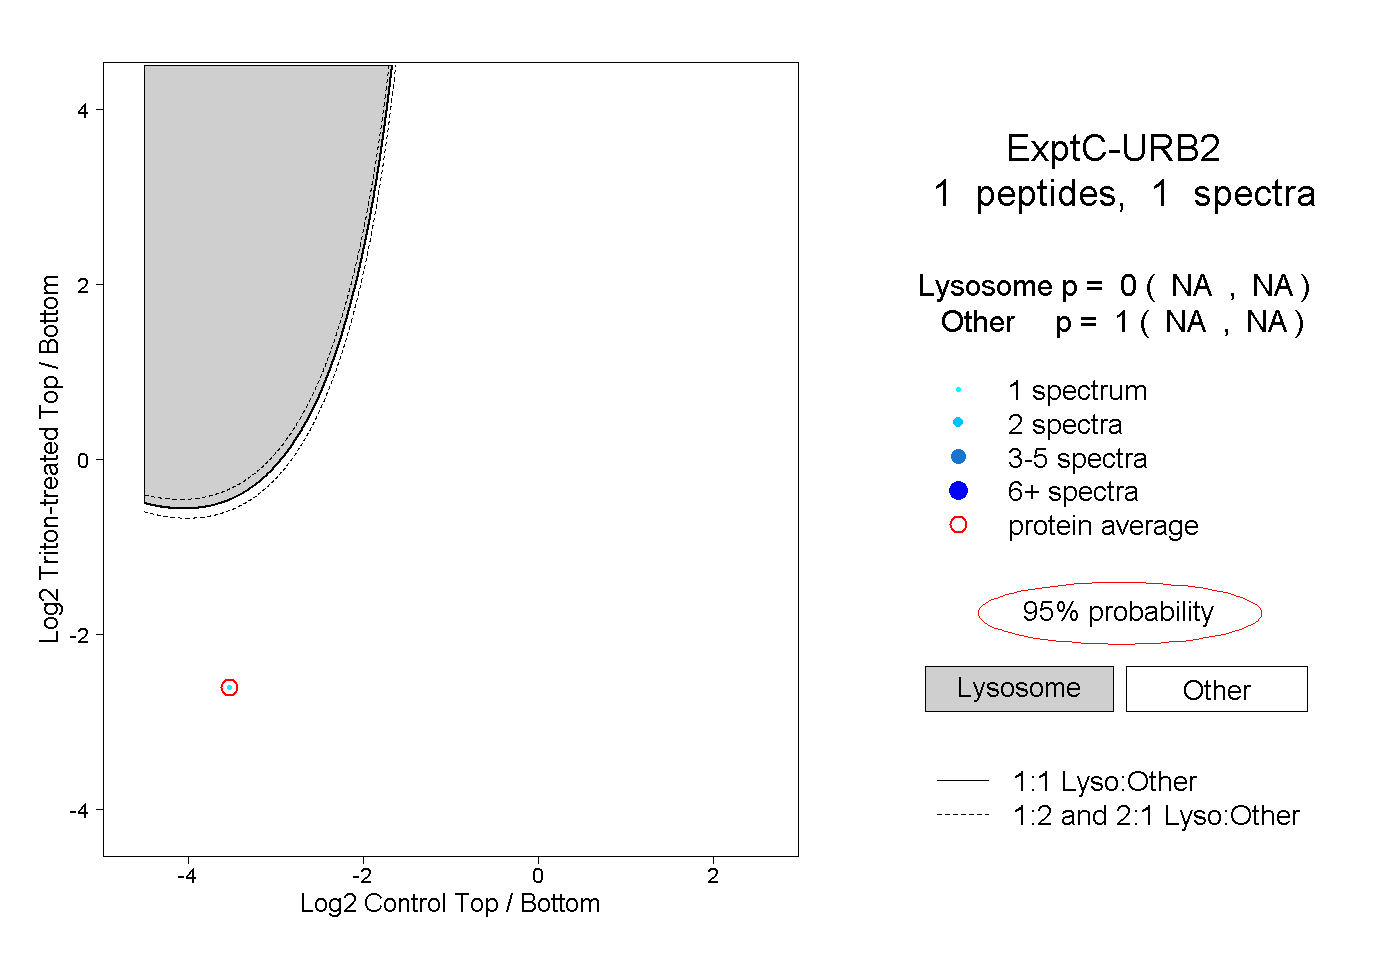 |
0.000 NA | NA |
1.000 NA | NA |