14
14peptides
spectra
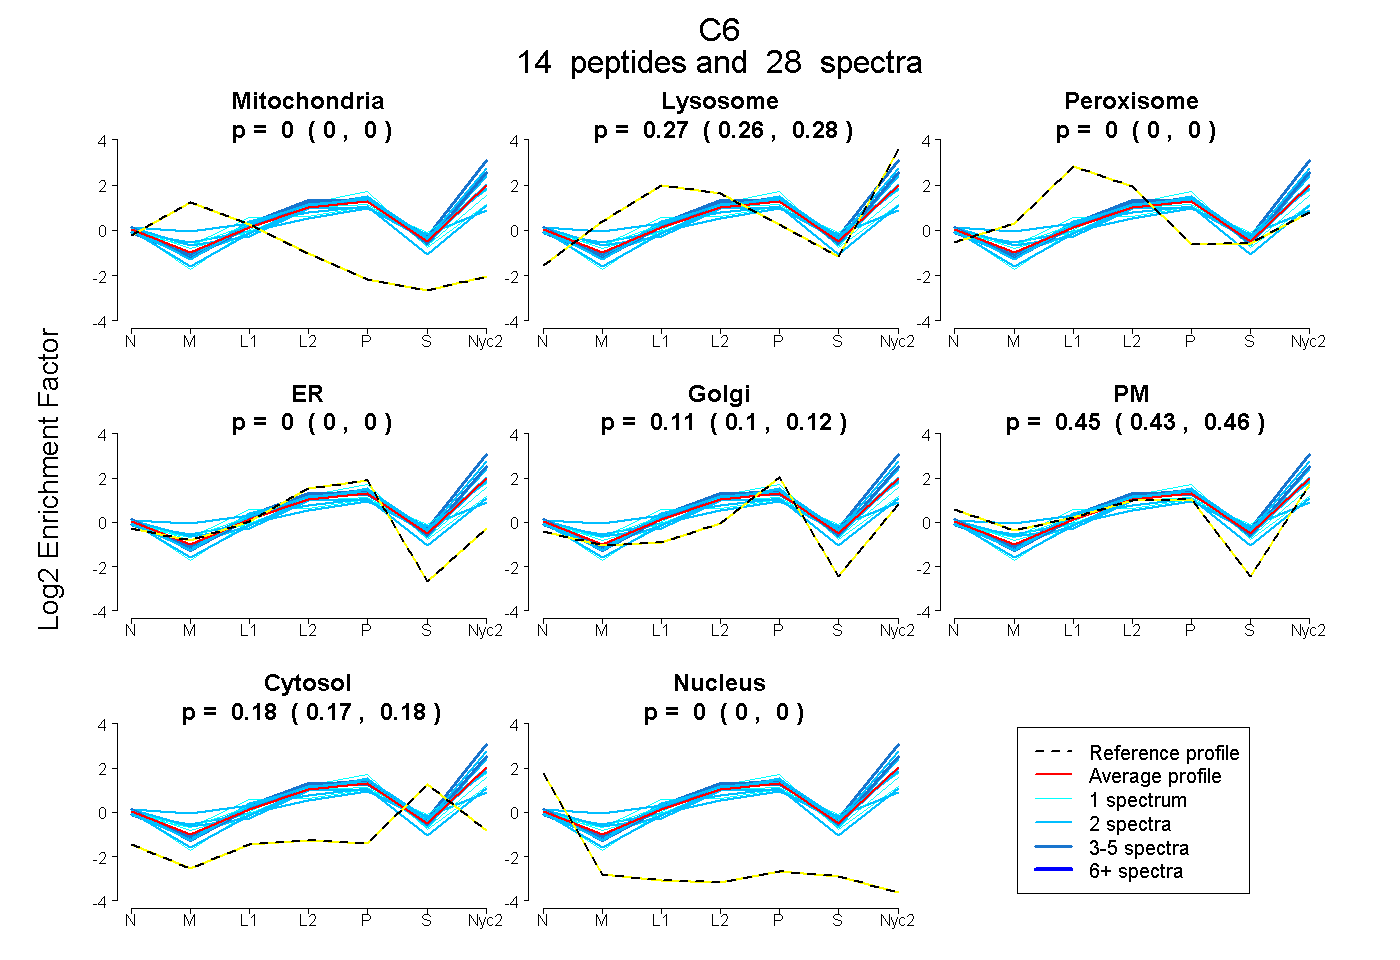
0.000 | 0.000
0.258 | 0.277
0.000 | 0.000
0.000 | 0.000
0.099 | 0.118
0.435 | 0.455
0.171 | 0.181
0.000 | 0.000
5peptides
spectra
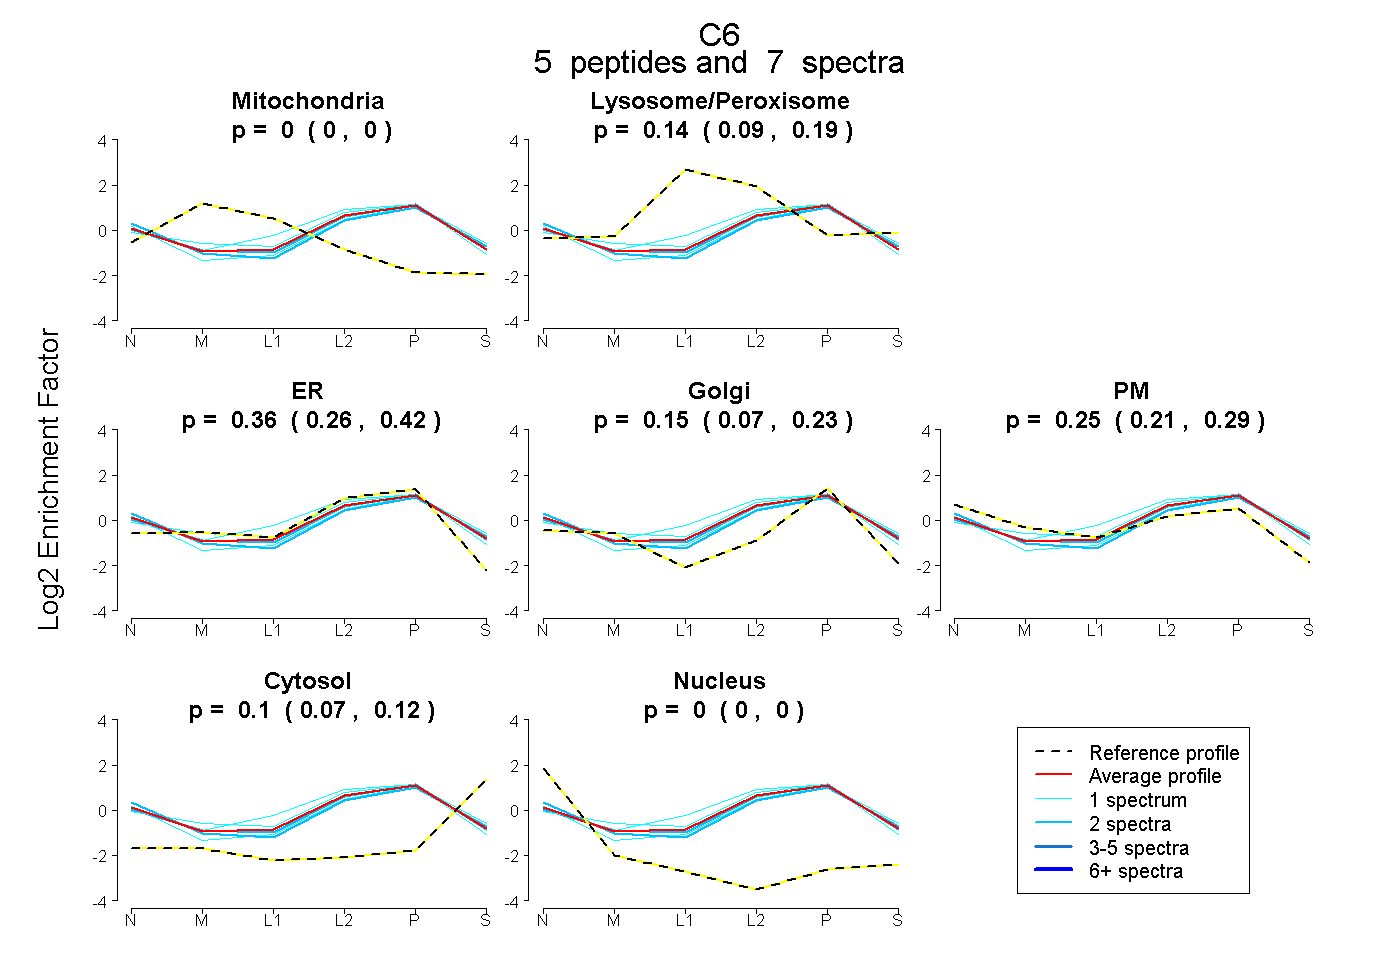
0.000 | 0.000
0.093 | 0.186
0.263 | 0.424
0.068 | 0.226
0.211 | 0.287
0.074 | 0.120
0.000 | 0.000
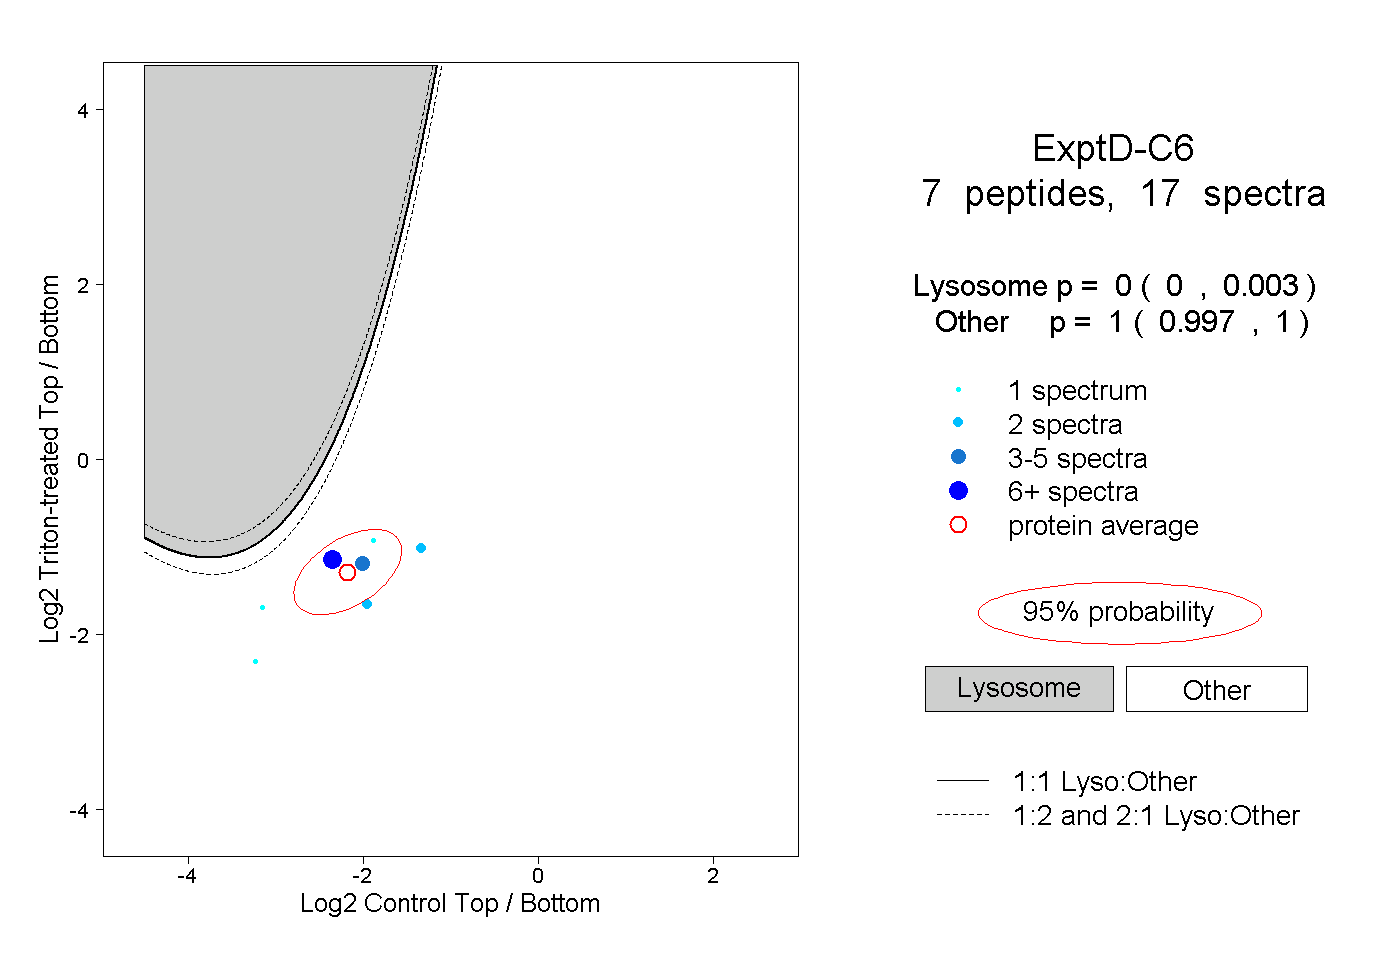
18peptides
spectra
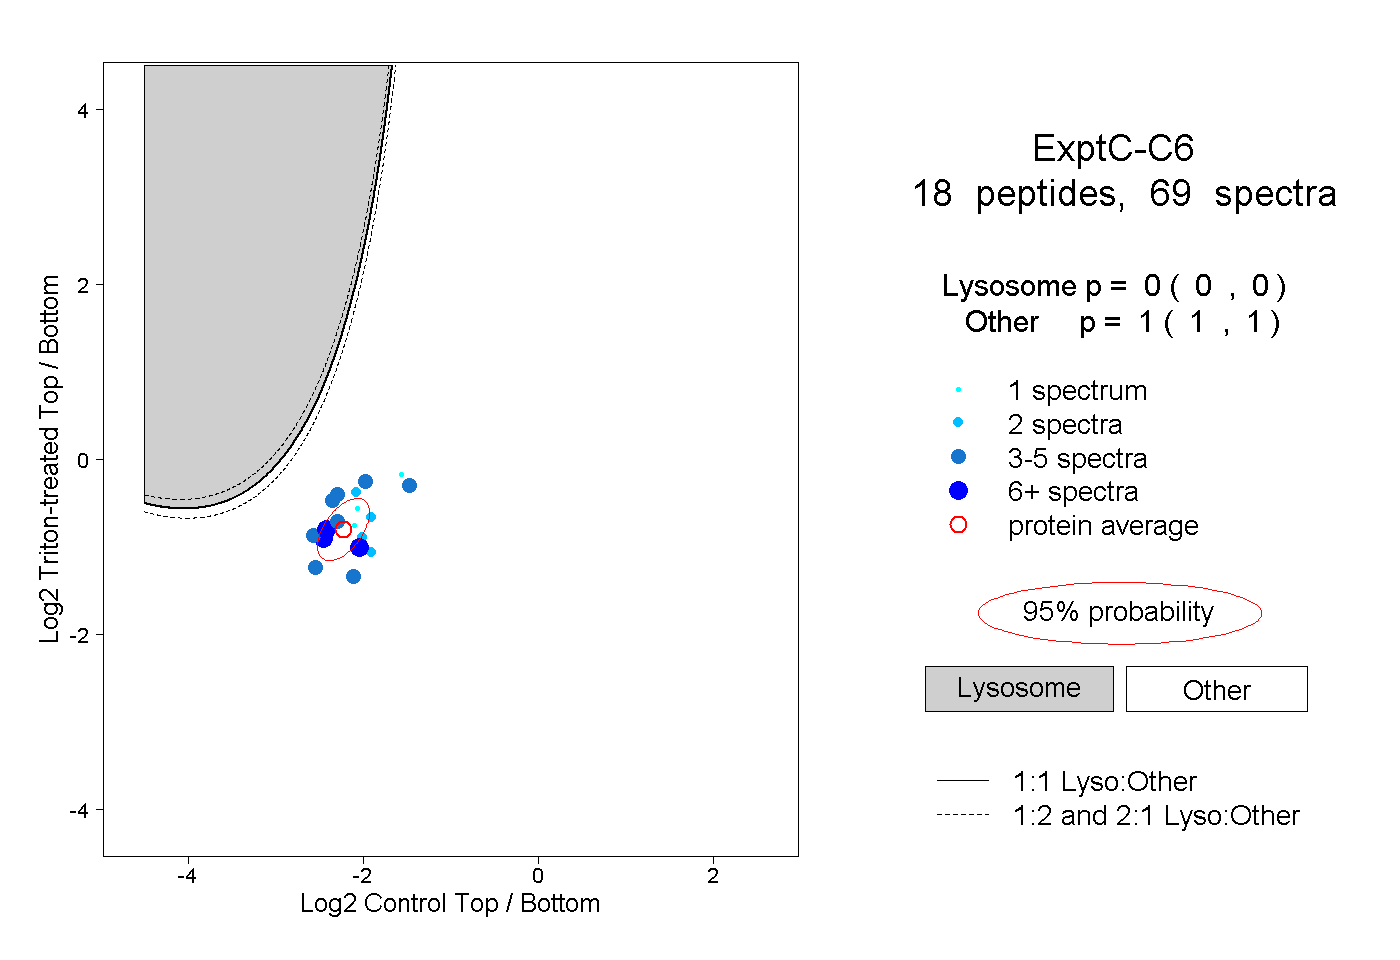
0.000 | 0.000
1.000 | 1.000