 14
14peptides
spectra
0.000 | 0.000
0.258 | 0.277
0.000 | 0.000
0.000 | 0.000
0.099 | 0.118
0.435 | 0.455
0.171 | 0.181
0.000 | 0.000
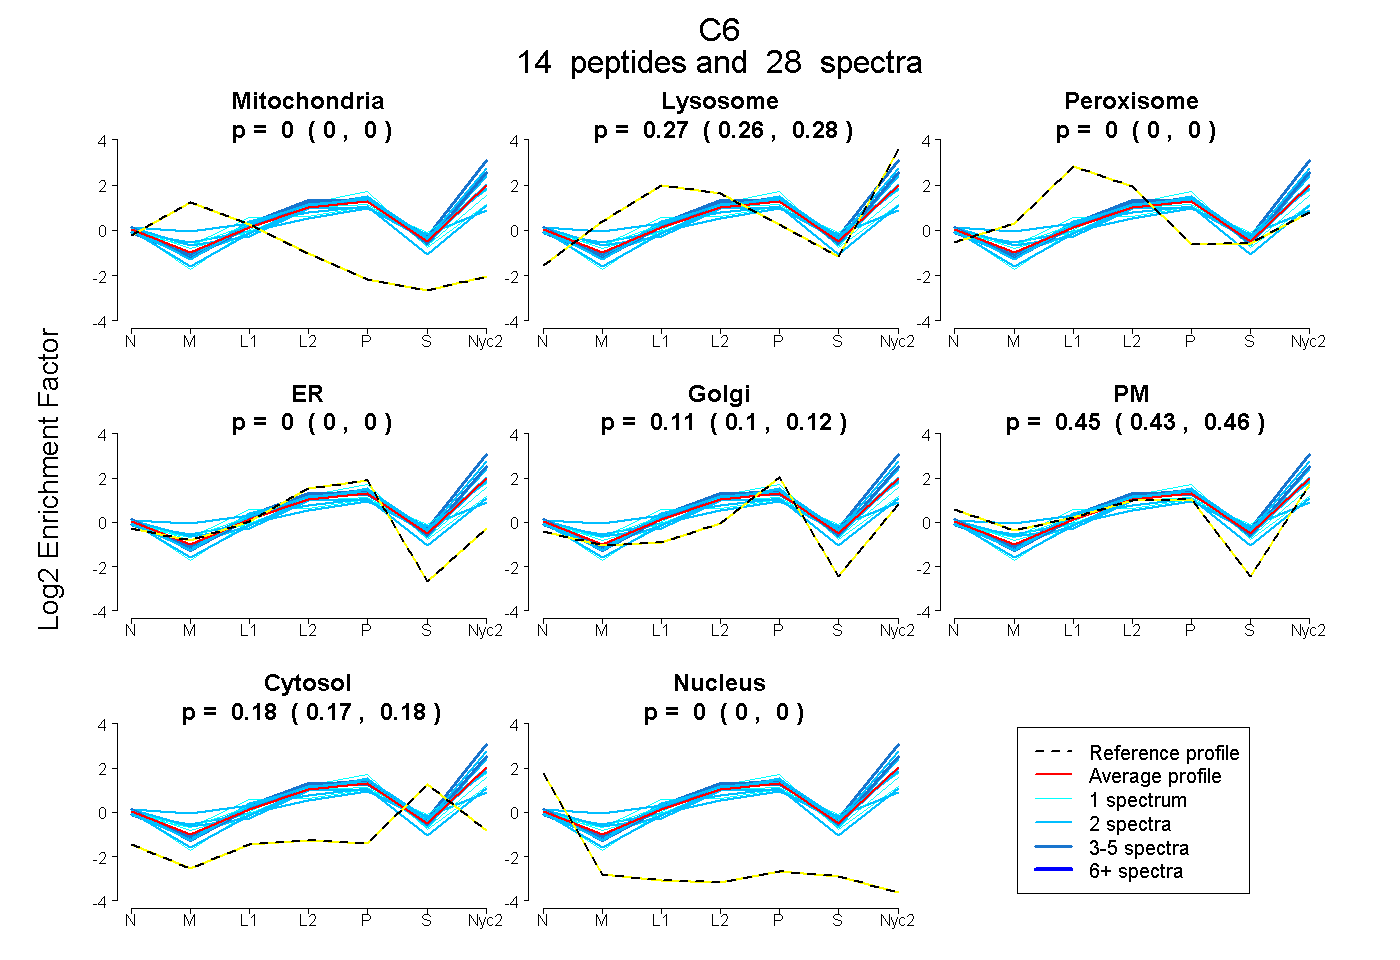
| Plot | Mito | Lyso | Perox | ER | Golgi | PM | Cytosol | Nucleus | |||||
| Expt A |
14 peptides |
28 spectra |
|
0.000 0.000 | 0.000 |
0.269 0.258 | 0.277 |
0.000 0.000 | 0.000 |
0.000 0.000 | 0.000 |
0.109 0.099 | 0.118 |
0.445 0.435 | 0.455 |
0.176 0.171 | 0.181 |
0.000 0.000 | 0.000 |
| 2 spectra, YDLLYQFSR | 0.000 | 0.359 | 0.000 | 0.000 | 0.082 | 0.417 | 0.142 | 0.000 | ||
| 2 spectra, TKPVCSR | 0.000 | 0.223 | 0.000 | 0.000 | 0.215 | 0.348 | 0.214 | 0.000 | ||
| 2 spectra, DSFYVPIFYSSK | 0.000 | 0.316 | 0.000 | 0.000 | 0.184 | 0.389 | 0.111 | 0.000 | ||
| 2 spectra, HWQEEDCTFSIMEK | 0.000 | 0.066 | 0.177 | 0.000 | 0.225 | 0.276 | 0.256 | 0.000 | ||
| 1 spectrum, DNSCDQLCTK | 0.000 | 0.135 | 0.000 | 0.302 | 0.122 | 0.260 | 0.182 | 0.000 | ||
| 2 spectra, QELQNSGLTEEETR | 0.000 | 0.223 | 0.000 | 0.000 | 0.012 | 0.553 | 0.211 | 0.000 | ||
| 2 spectra, FLCDSGR | 0.000 | 0.207 | 0.000 | 0.000 | 0.126 | 0.497 | 0.170 | 0.000 | ||
| 2 spectra, IGESIELTCPR | 0.000 | 0.019 | 0.259 | 0.000 | 0.264 | 0.382 | 0.076 | 0.000 | ||
| 1 spectrum, IEETDCK | 0.000 | 0.239 | 0.006 | 0.140 | 0.043 | 0.418 | 0.154 | 0.000 | ||
| 1 spectrum, GDSWTPPIPNSLSCEK | 0.000 | 0.322 | 0.055 | 0.000 | 0.086 | 0.308 | 0.229 | 0.000 | ||
| 4 spectra, SISLVQGGR | 0.000 | 0.312 | 0.000 | 0.000 | 0.118 | 0.444 | 0.126 | 0.000 | ||
| 4 spectra, FLFFTK | 0.000 | 0.464 | 0.000 | 0.000 | 0.062 | 0.343 | 0.131 | 0.000 | ||
| 2 spectra, GFVVAGPSR | 0.000 | 0.364 | 0.000 | 0.000 | 0.181 | 0.322 | 0.134 | 0.000 | ||
| 1 spectrum, NIPCAVTK | 0.000 | 0.232 | 0.000 | 0.000 | 0.036 | 0.517 | 0.215 | 0.000 |
| Plot | Mito | Lyso or Perox | ER | Golgi | PM | Cytosol | Nucleus | ||||||
| Expt B |
5 peptides |
7 spectra |
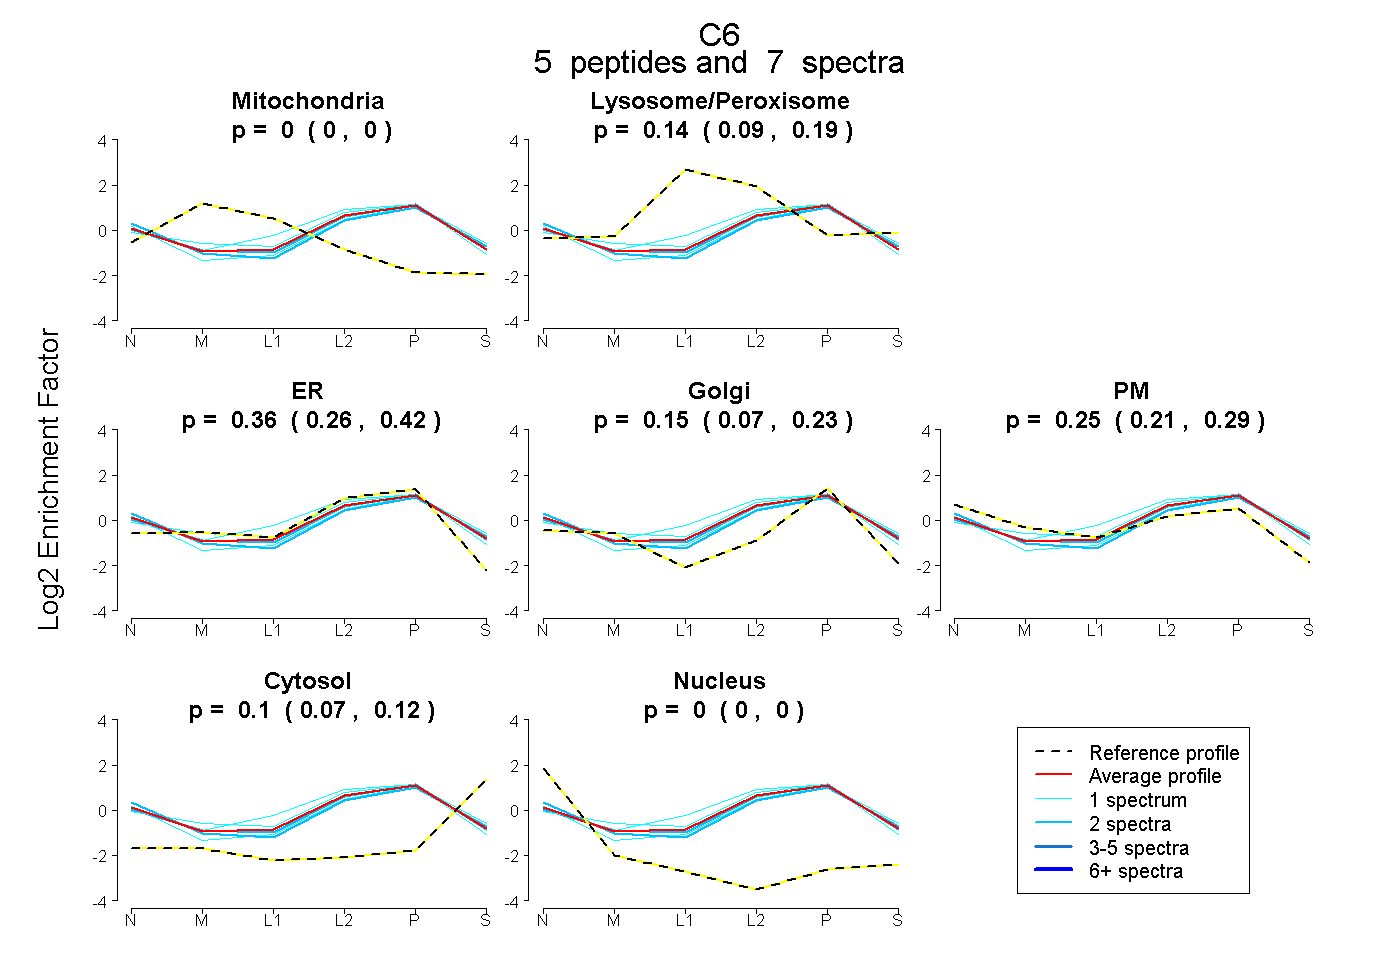 |
0.000 0.000 | 0.000 |
0.143 0.093 | 0.186 |
0.355 0.263 | 0.424 |
0.151 0.068 | 0.226 |
0.252 0.211 | 0.287 |
0.098 0.074 | 0.120 |
0.000 0.000 | 0.000 |
|||
| Plot | Lyso | Other | |||||||||||
| Expt C |
18 peptides |
69 spectra |
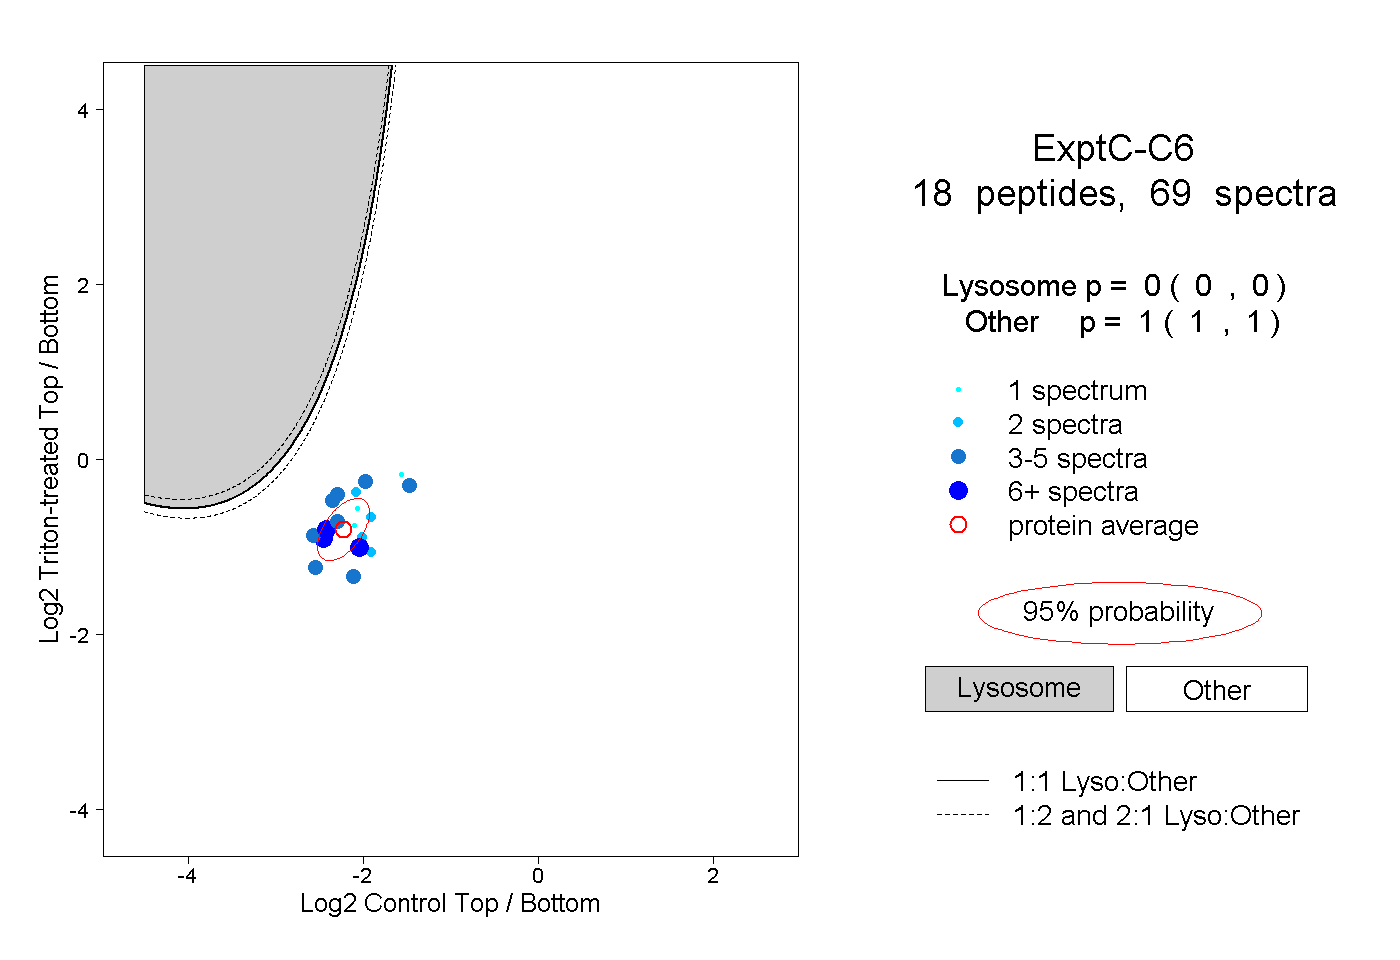 |
0.000 0.000 | 0.000 |
1.000 1.000 | 1.000 |
||||||||
| Plot | Lyso | Other | |||||||||||
| Expt D |
7 peptides |
17 spectra |
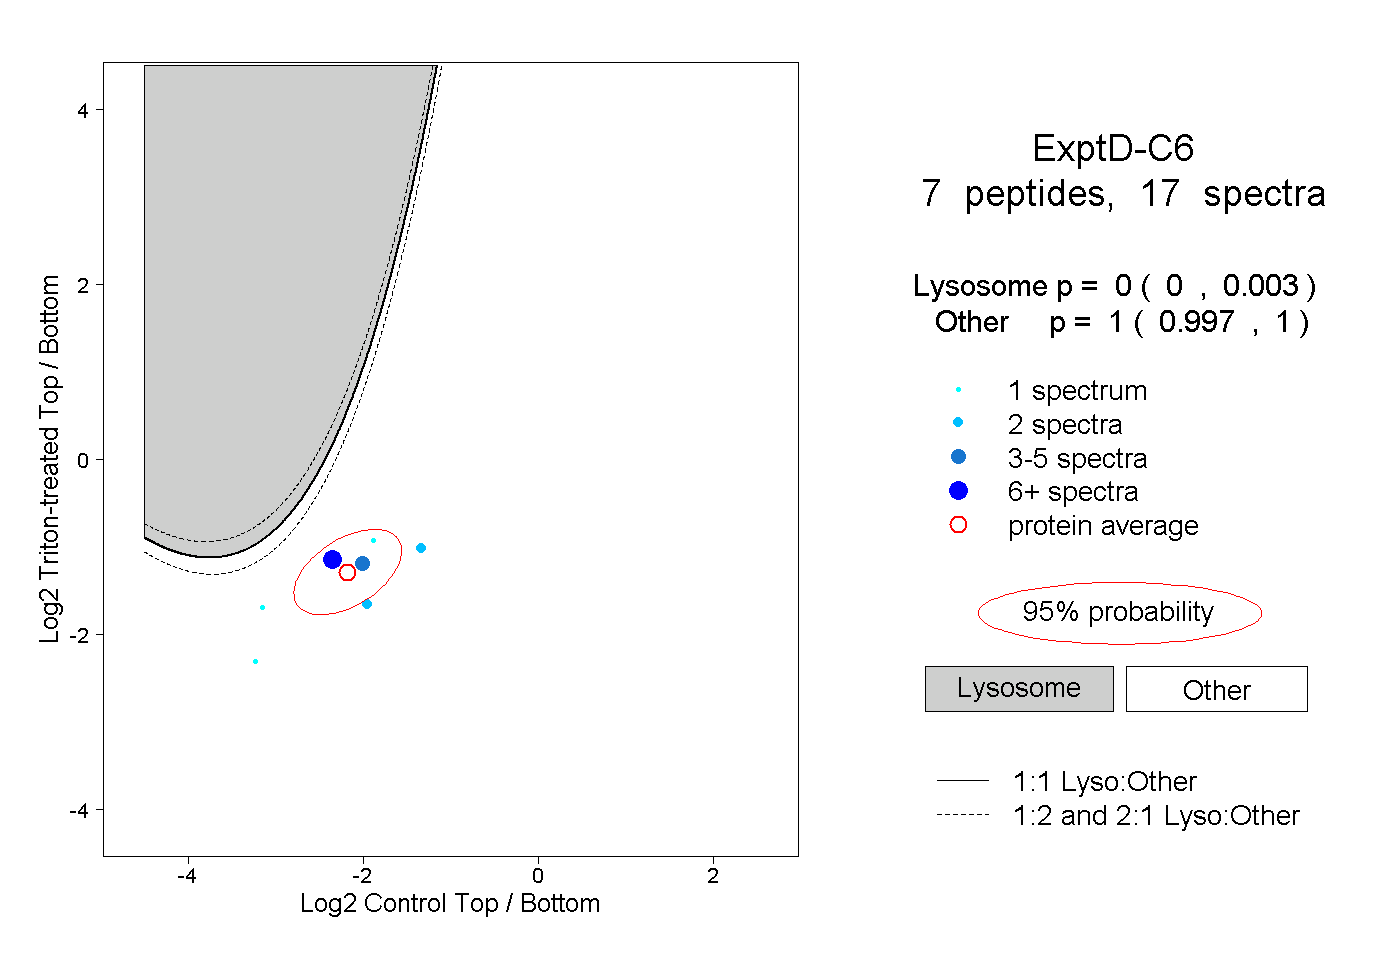 |
0.000 0.000 | 0.003 |
1.000 0.997 | 1.000 |