15
15peptides
spectra
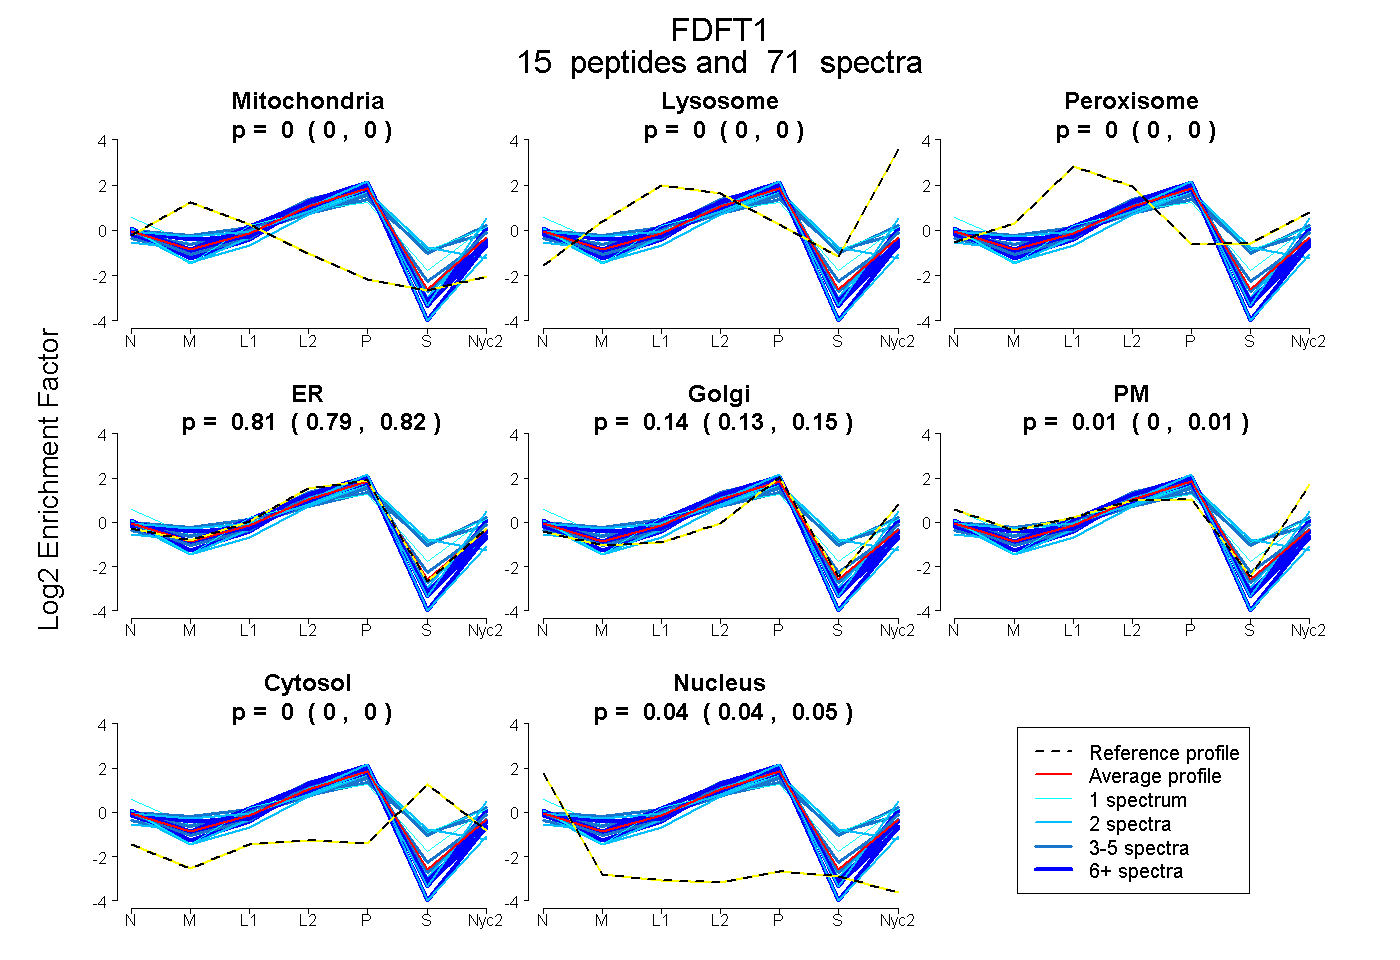
0.000 | 0.003
0.000 | 0.000
0.000 | 0.001
0.794 | 0.816
0.134 | 0.152
0.000 | 0.014
0.000 | 0.000
0.041 | 0.046
8peptides
spectra
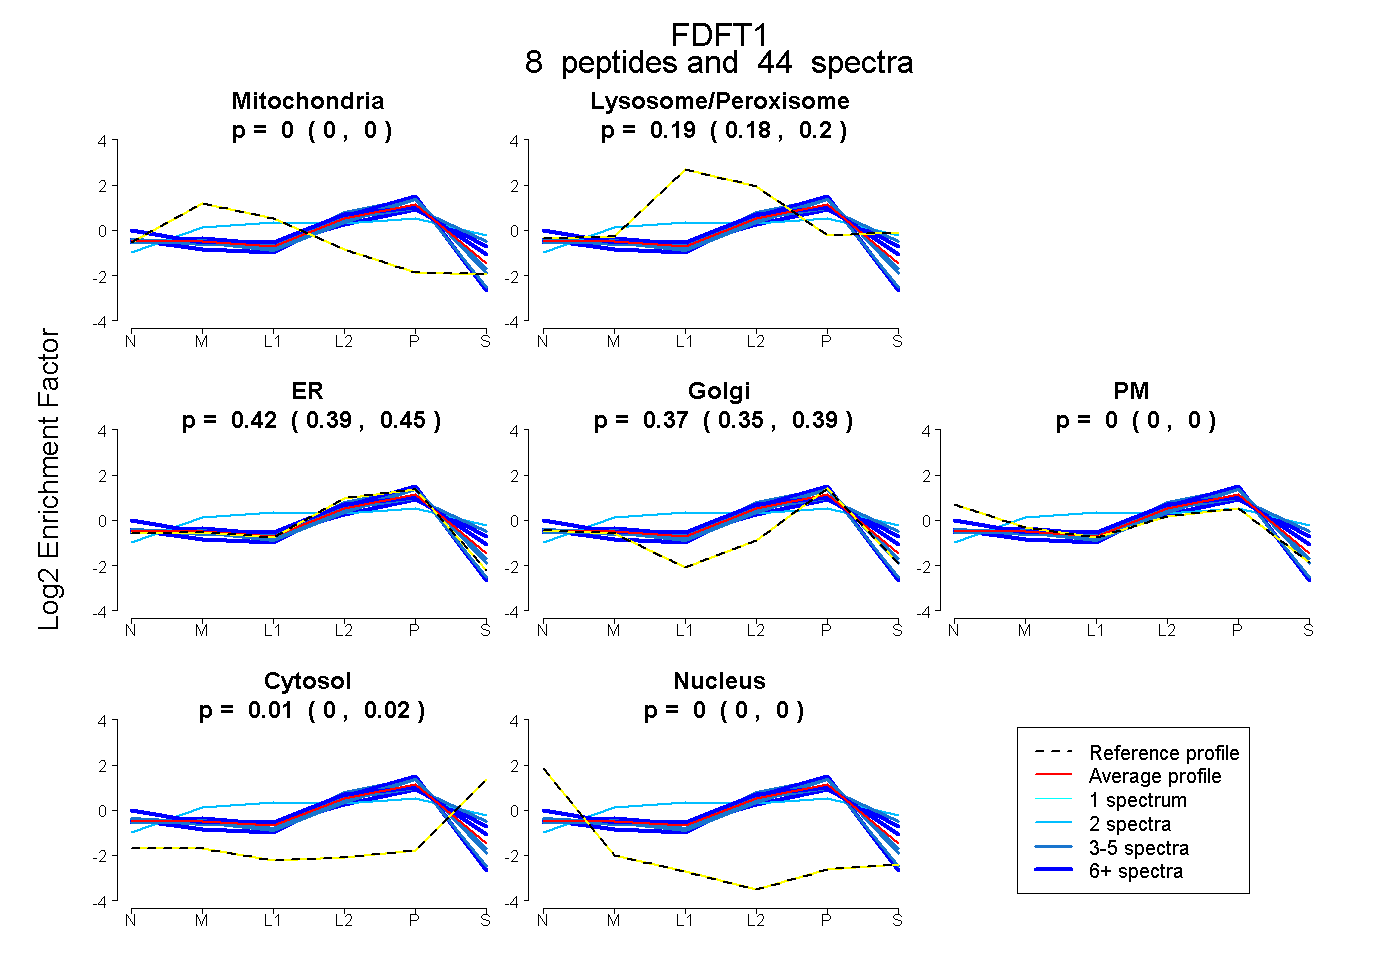
0.000 | 0.000
0.177 | 0.203
0.387 | 0.448
0.351 | 0.395
0.000 | 0.000
0.004 | 0.023
0.000 | 0.000
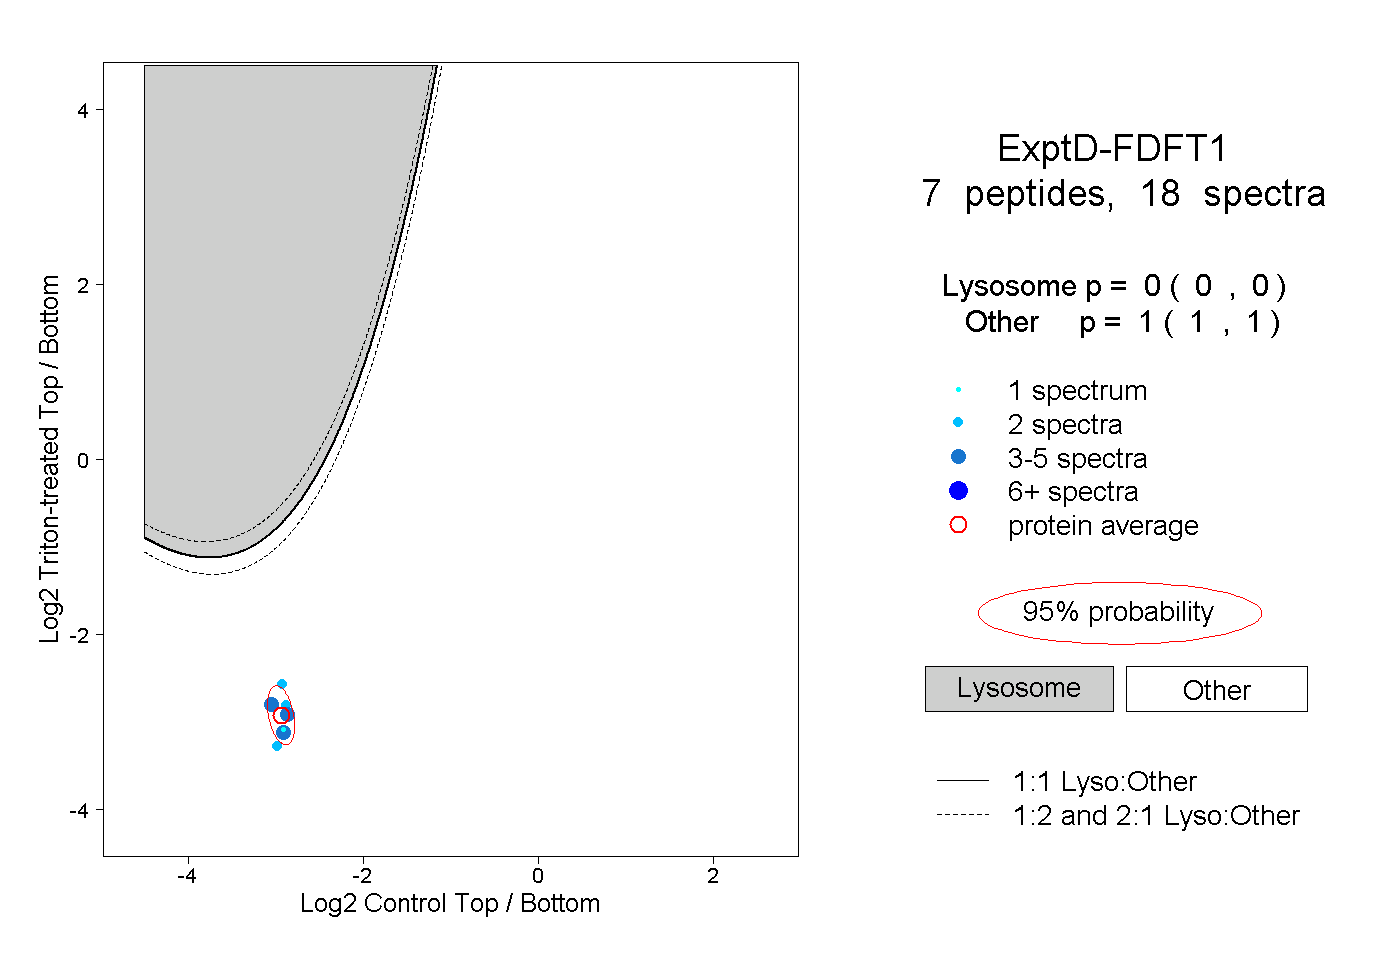
15peptides
spectra
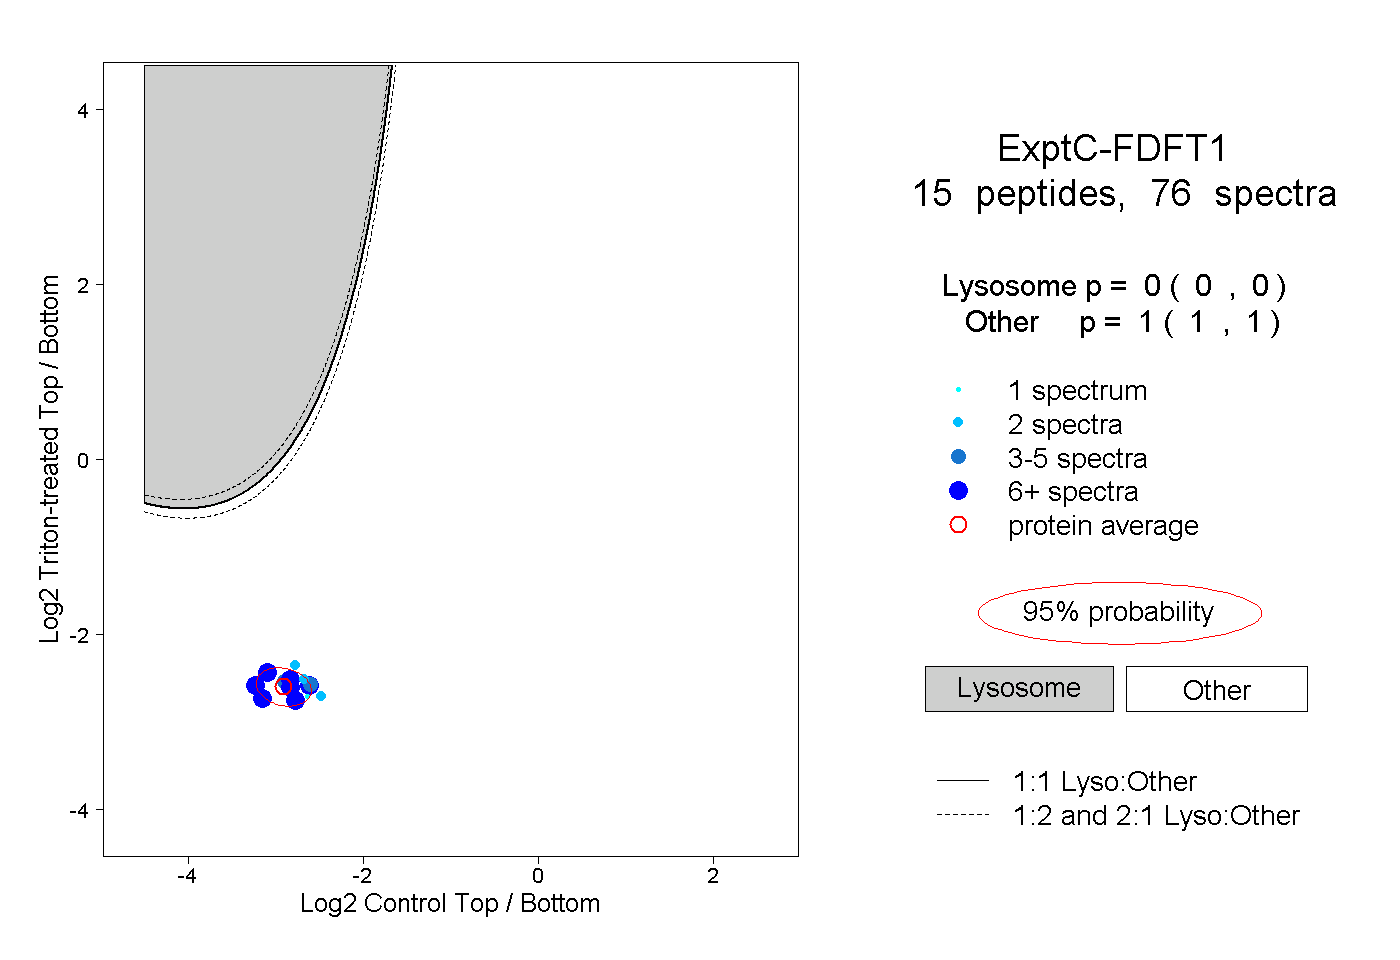
0.000 | 0.000
1.000 | 1.000