FDFT1
[ENSRNOP00000029808]
Main page
| | | Plot |
Mito |
Lyso |
|
Perox |
ER |
Golgi |
PM |
Cytosol |
Nucleus |
|
| Expt A |
 15
15
peptides |
71
spectra |
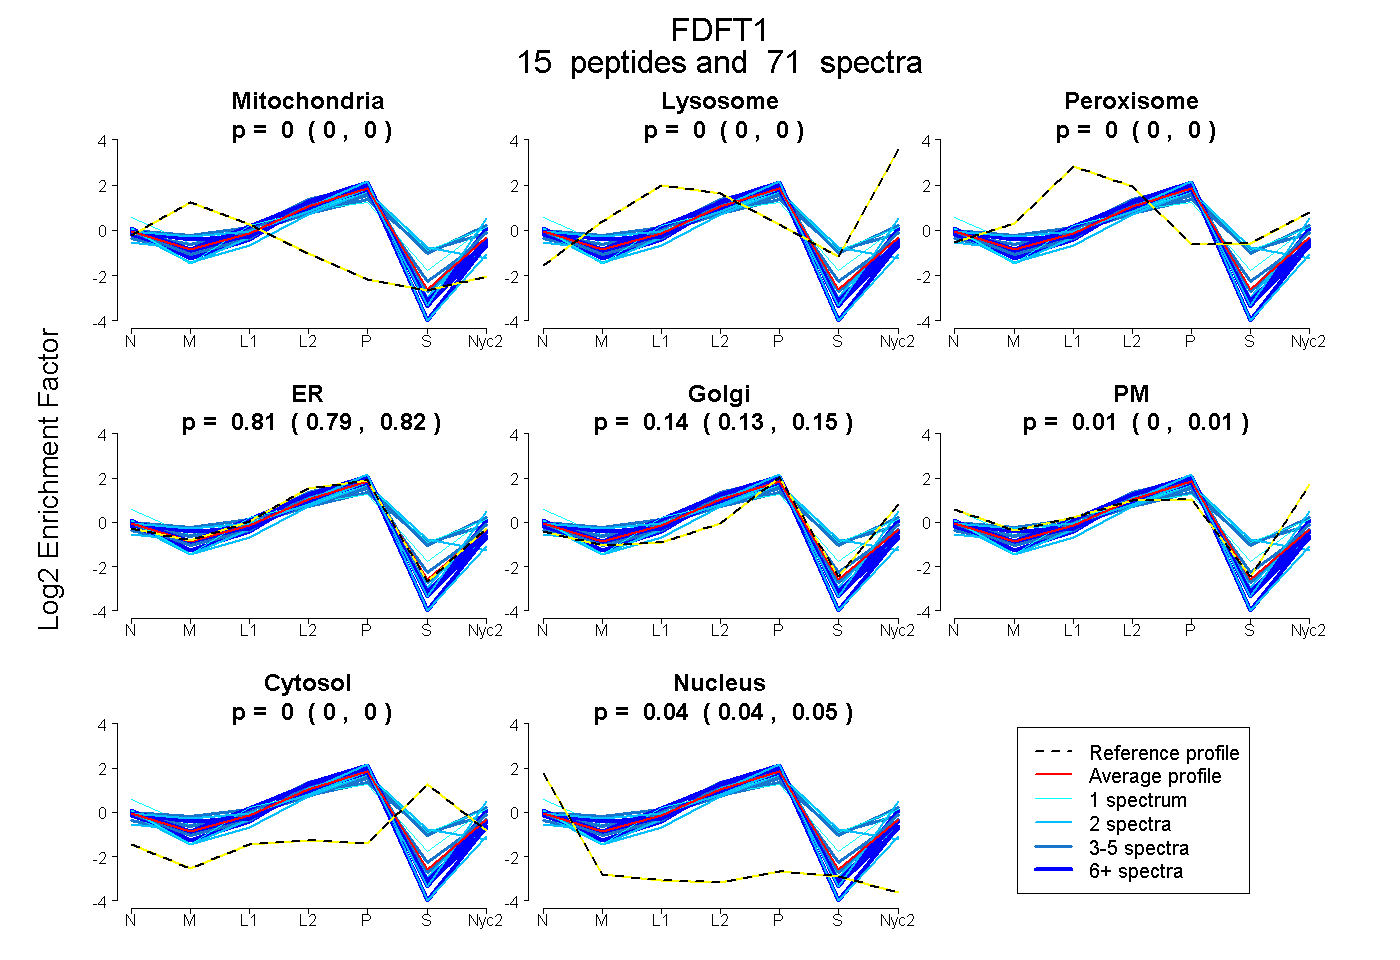 |
0.000
0.000 | 0.003 |
0.000
0.000 | 0.000 |
|
0.000
0.000 | 0.001 |
0.807
0.794 | 0.816 |
0.143
0.134 | 0.152 |
0.007
0.000 | 0.014 |
0.000
0.000 | 0.000 |
0.044
0.041 | 0.046 |
|
| | | Plot |
Mito |
|
Lyso or Perox |
|
ER |
Golgi |
PM |
Cytosol |
Nucleus |
|
| Expt B |
8
peptides |
44
spectra |
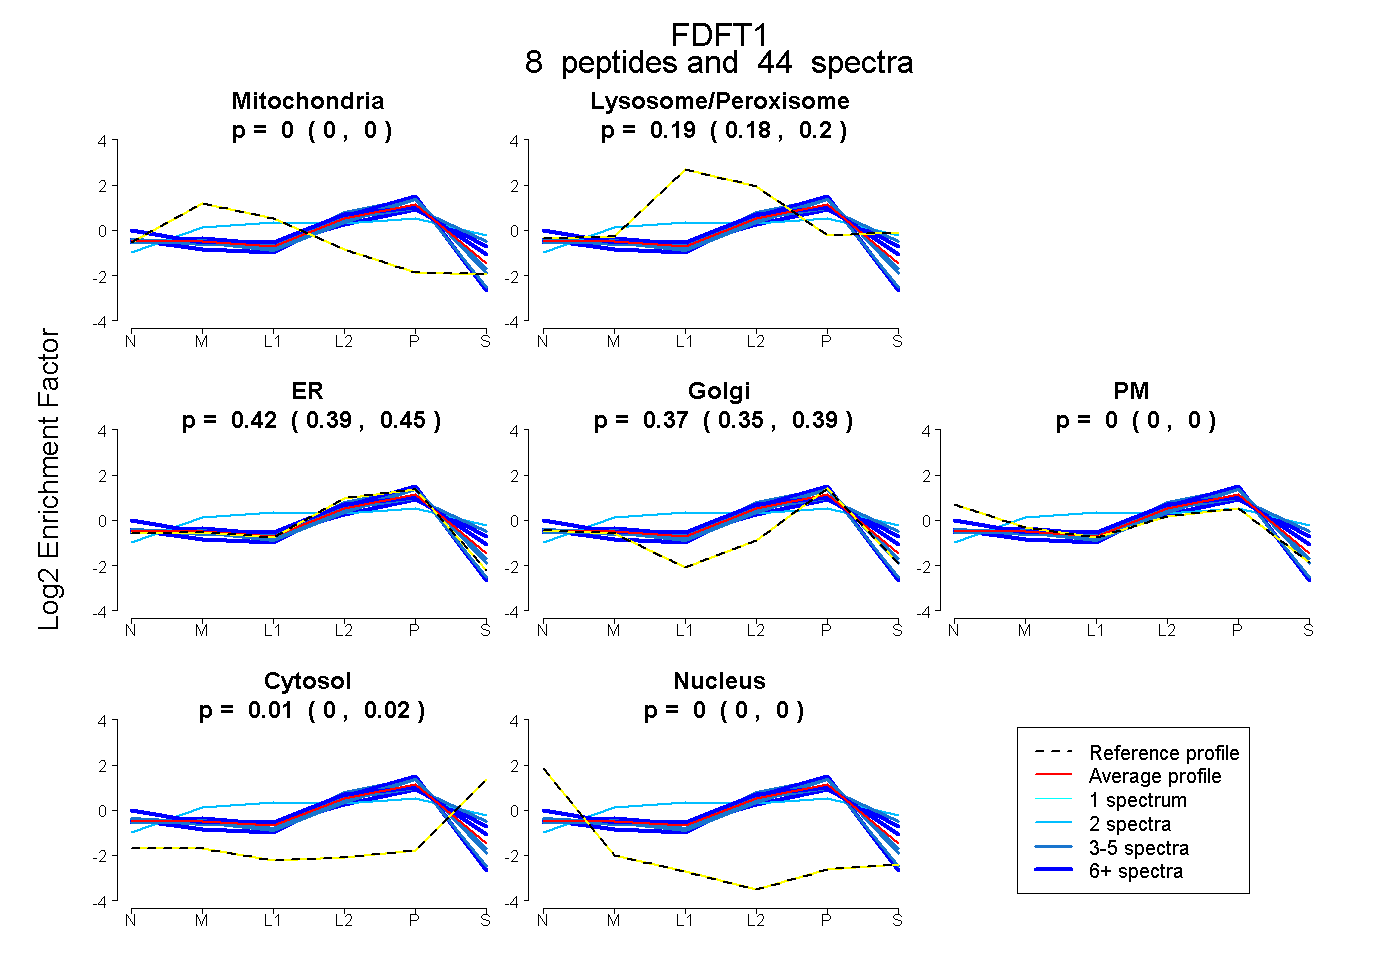 |
0.000
0.000 | 0.000 |
|
0.192
0.177 | 0.203 |
|
0.420
0.387 | 0.448 |
0.374
0.351 | 0.395 |
0.000
0.000 | 0.000 |
0.014
0.004 | 0.023 |
0.000
0.000 | 0.000 |
|
| 3 spectra, NSLSNSLK |
0.000 |
|
0.301 |
|
0.224 |
0.359 |
0.000 |
0.116 |
0.000 |
|
| 5 spectra, QLISNIR |
0.024 |
|
0.000 |
|
0.820 |
0.145 |
0.000 |
0.000 |
0.011 |
|
| 3 spectra, YLDQTSR |
0.000 |
|
0.126 |
|
0.450 |
0.423 |
0.001 |
0.000 |
0.000 |
|
| 5 spectra, CLGHPEEFYNLLR |
0.000 |
|
0.059 |
|
0.776 |
0.166 |
0.000 |
0.000 |
0.000 |
|
| 2 spectra, NFHTFLYEPEWR |
0.012 |
|
0.504 |
|
0.000 |
0.362 |
0.000 |
0.121 |
0.000 |
|
| 10 spectra, DYLEDQQEGR |
0.000 |
|
0.000 |
|
0.858 |
0.118 |
0.000 |
0.000 |
0.025 |
|
| 9 spectra, AIIYQYIEEIYHR |
0.000 |
|
0.322 |
|
0.079 |
0.525 |
0.000 |
0.074 |
0.000 |
|
| 7 spectra, YQTVIADICHR |
0.000 |
|
0.231 |
|
0.278 |
0.244 |
0.218 |
0.029 |
0.000 |
|
| | | Plot |
|
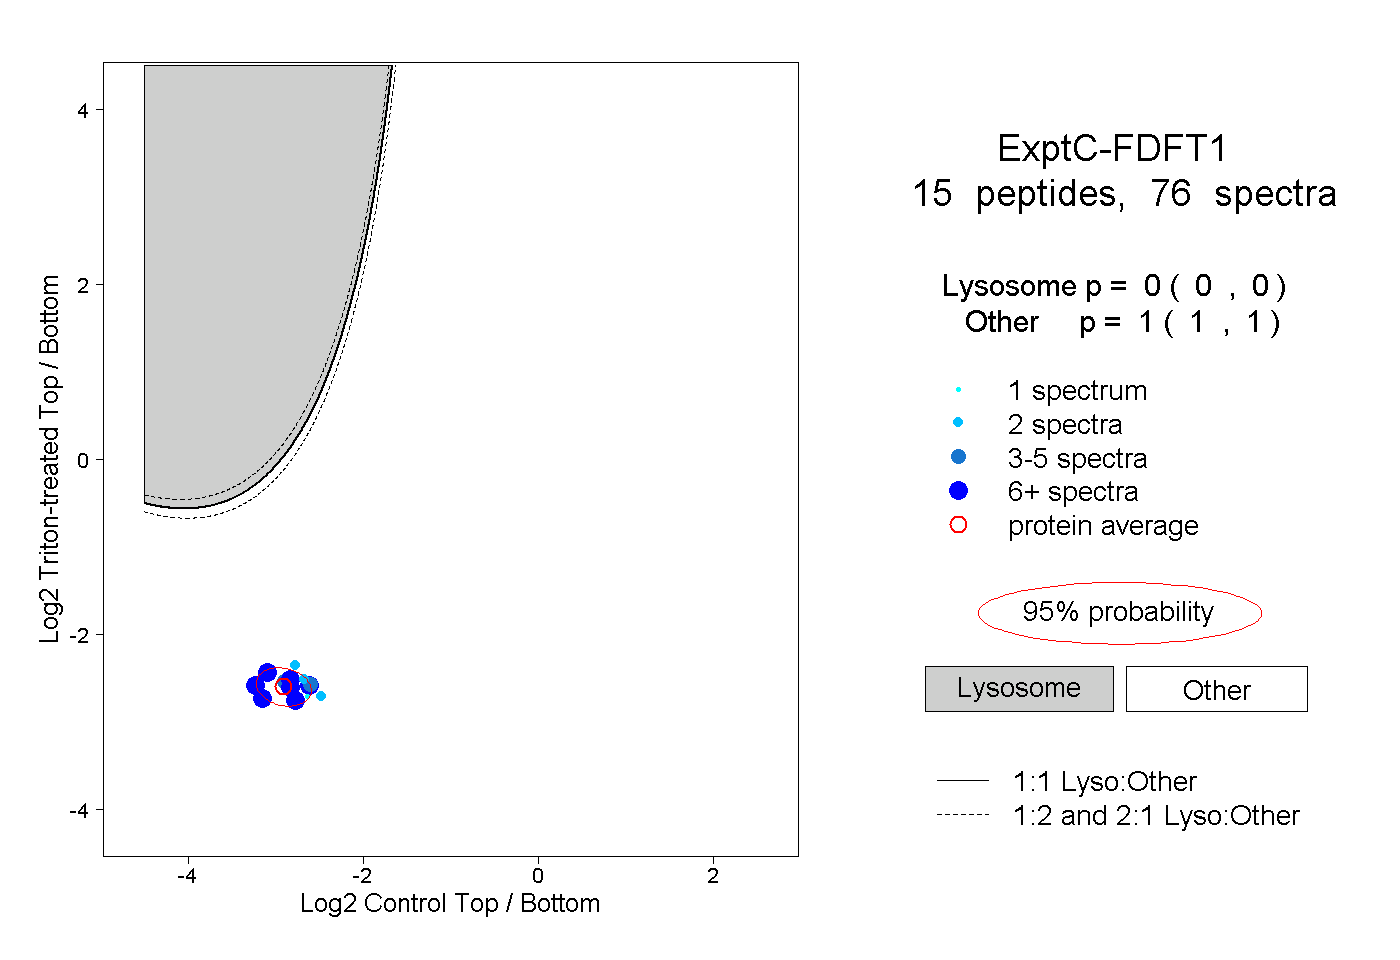
Lyso |
|
|
|
|
|
|
|
Other |
| Expt C |
15
peptides |
76
spectra |
 |
|
0.000
0.000 | 0.000 |
|
|
|
|
|
|
|
1.000
1.000 | 1.000 |
| | | Plot |
|
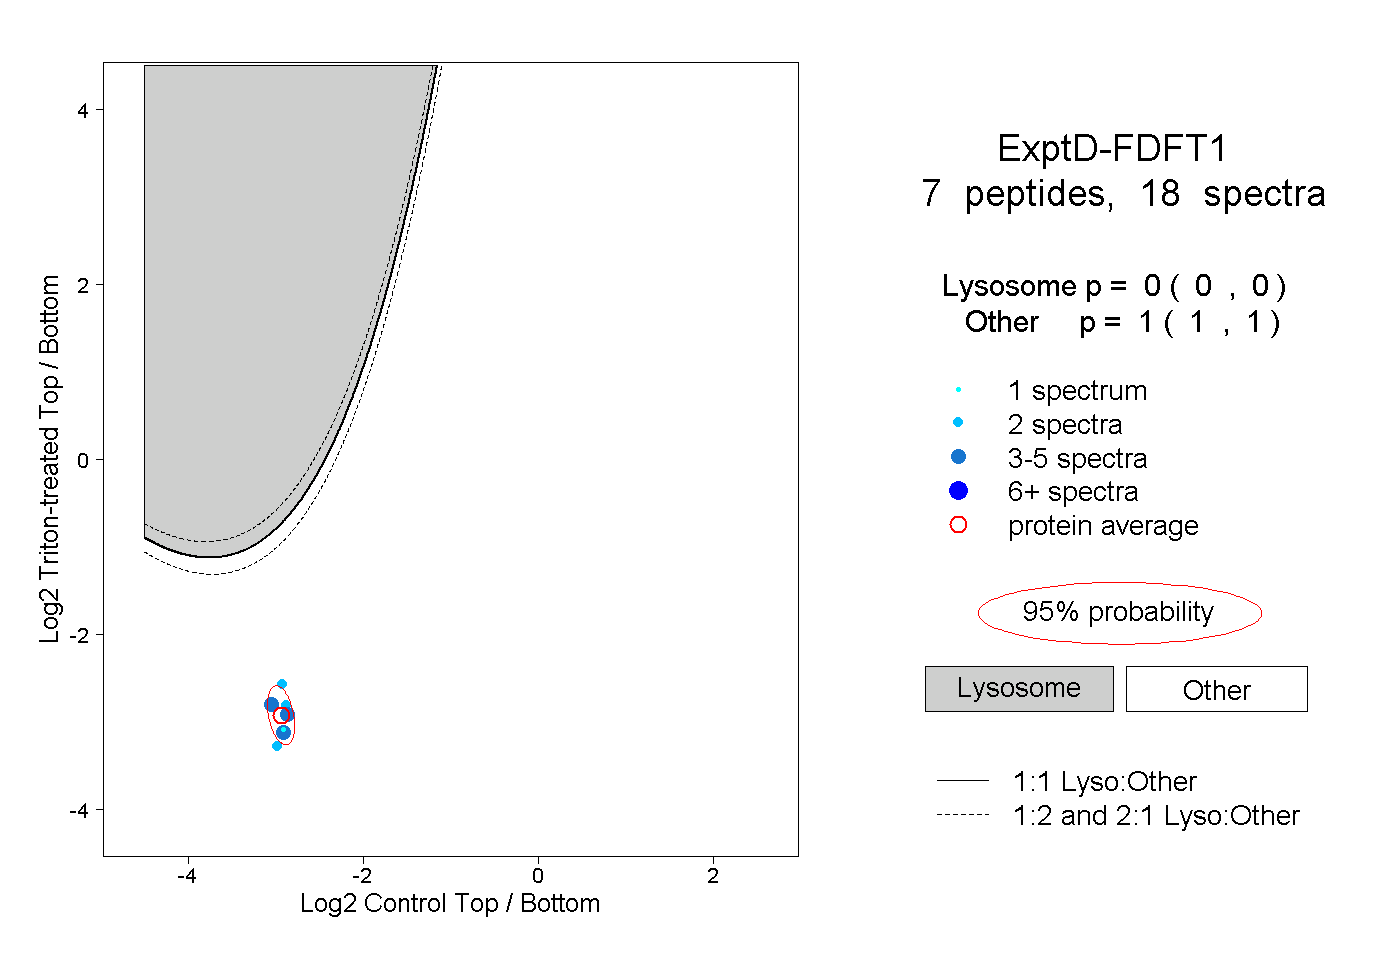
Lyso |
|
|
|
|
|
|
|
Other |
| Expt D |
7
peptides |
18
spectra |
 |
|
0.000
0.000 | 0.000 |
|
|
|
|
|
|
|
1.000
1.000 | 1.000 |