 1
1peptide
spectrum
NA | NA
NA | NA
NA | NA
NA | NA
NA | NA
NA | NA
NA | NA
NA | NA
11peptides
spectra
0.000 | 0.998
0.002 | 1.000
| Plot | Mito | Lyso | Perox | ER | Golgi | PM | Cytosol | Nucleus | |||||
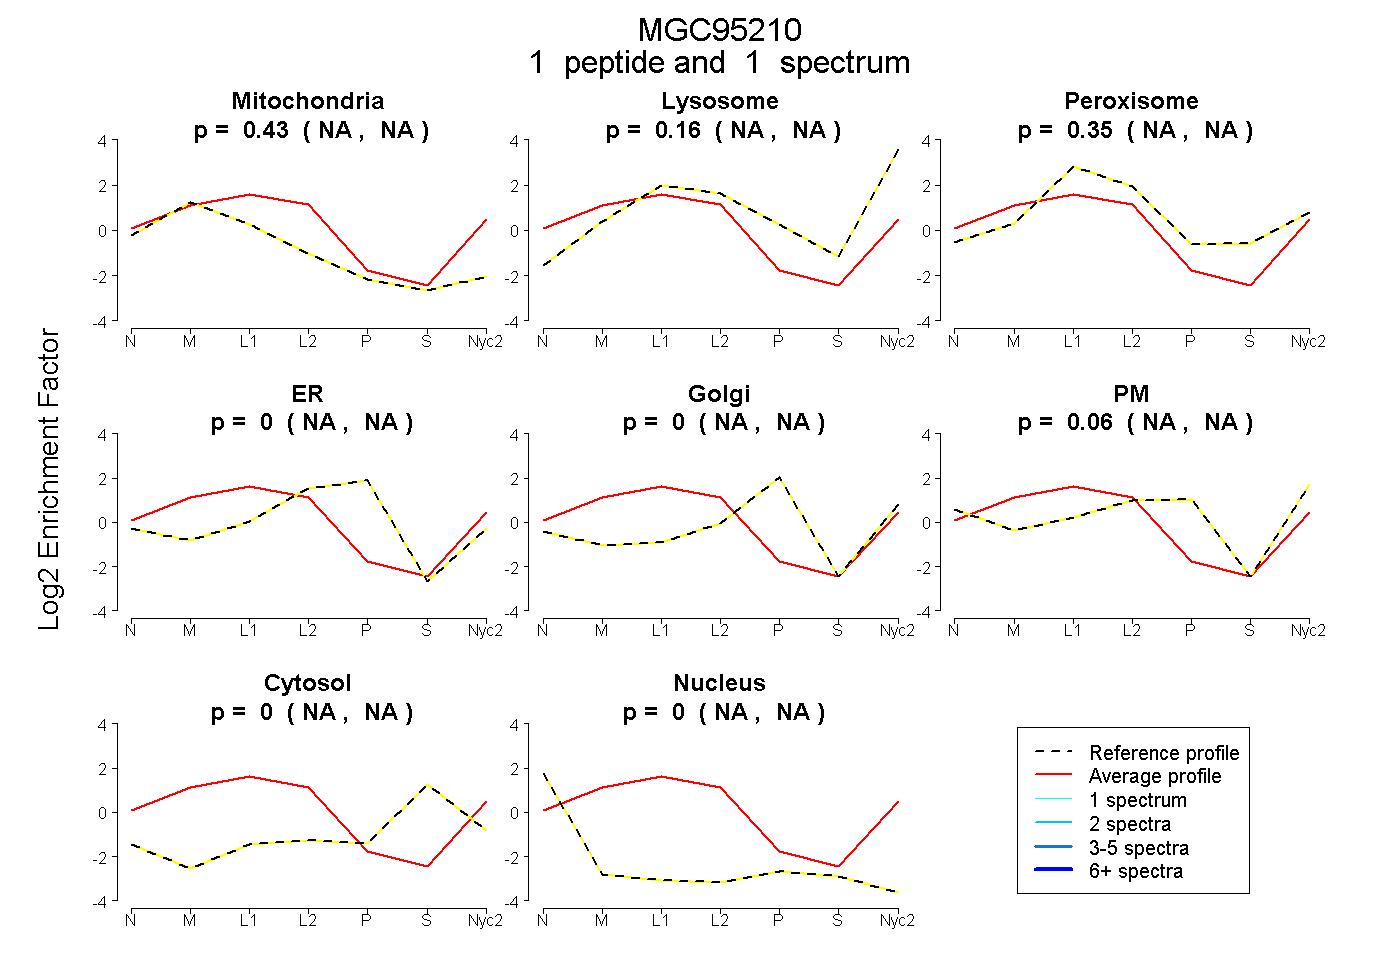
| Expt A |
1 peptide |
1 spectrum |
|
0.435 NA | NA |
0.164 NA | NA |
0.345 NA | NA |
0.000 NA | NA |
0.000 NA | NA |
0.056 NA | NA |
0.000 NA | NA |
0.000 NA | NA |
||
| Plot | Lyso | Other | |||||||||||
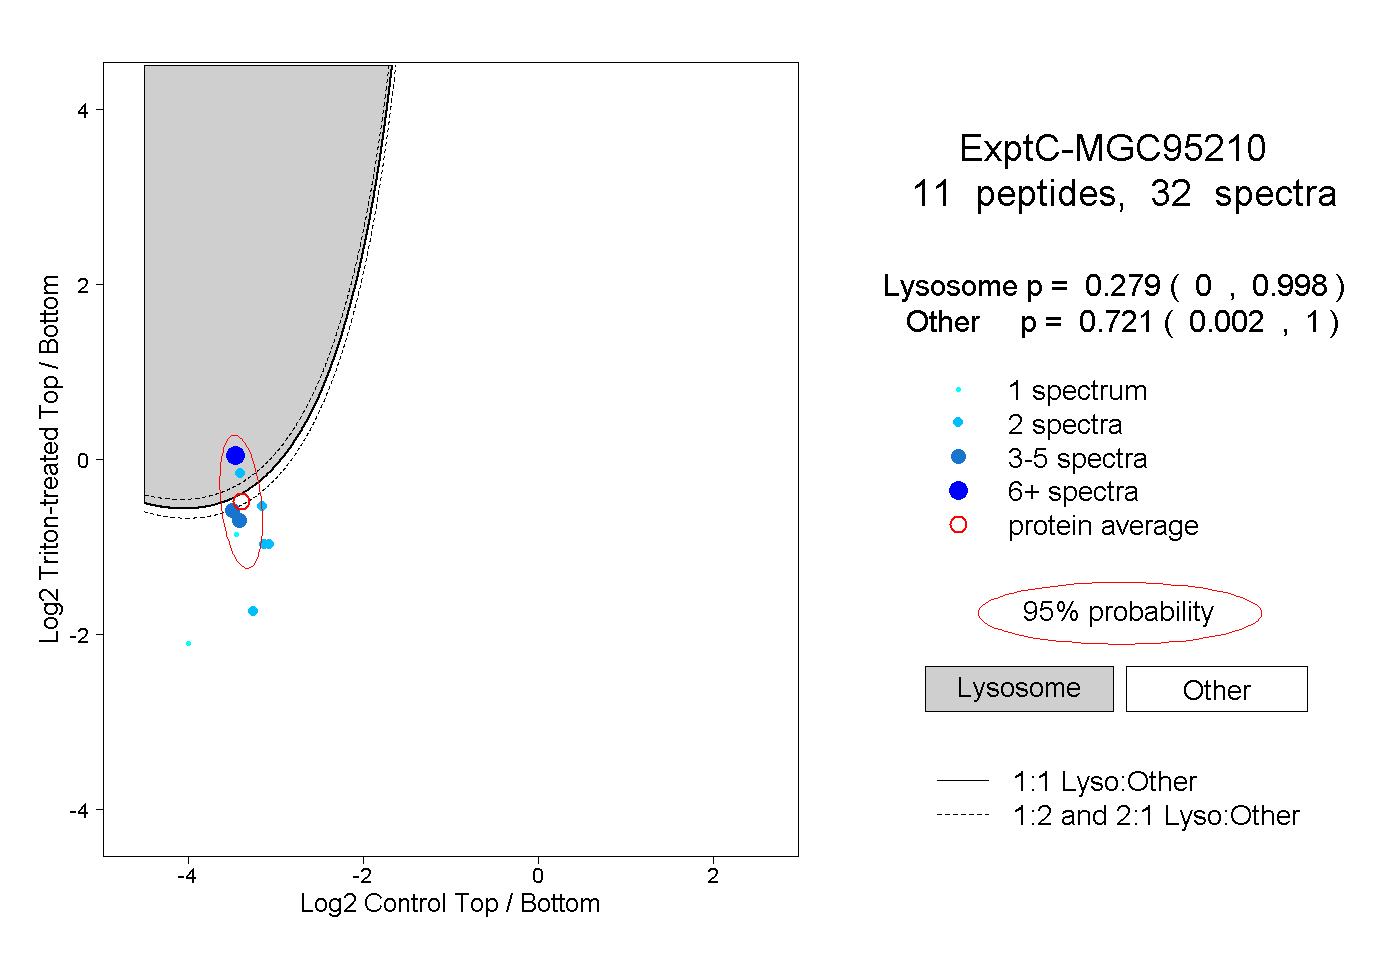
| Expt C |
11 peptides |
32 spectra |
|
0.279 0.000 | 0.998 |
0.721 0.002 | 1.000 |