 3
3peptides
spectra
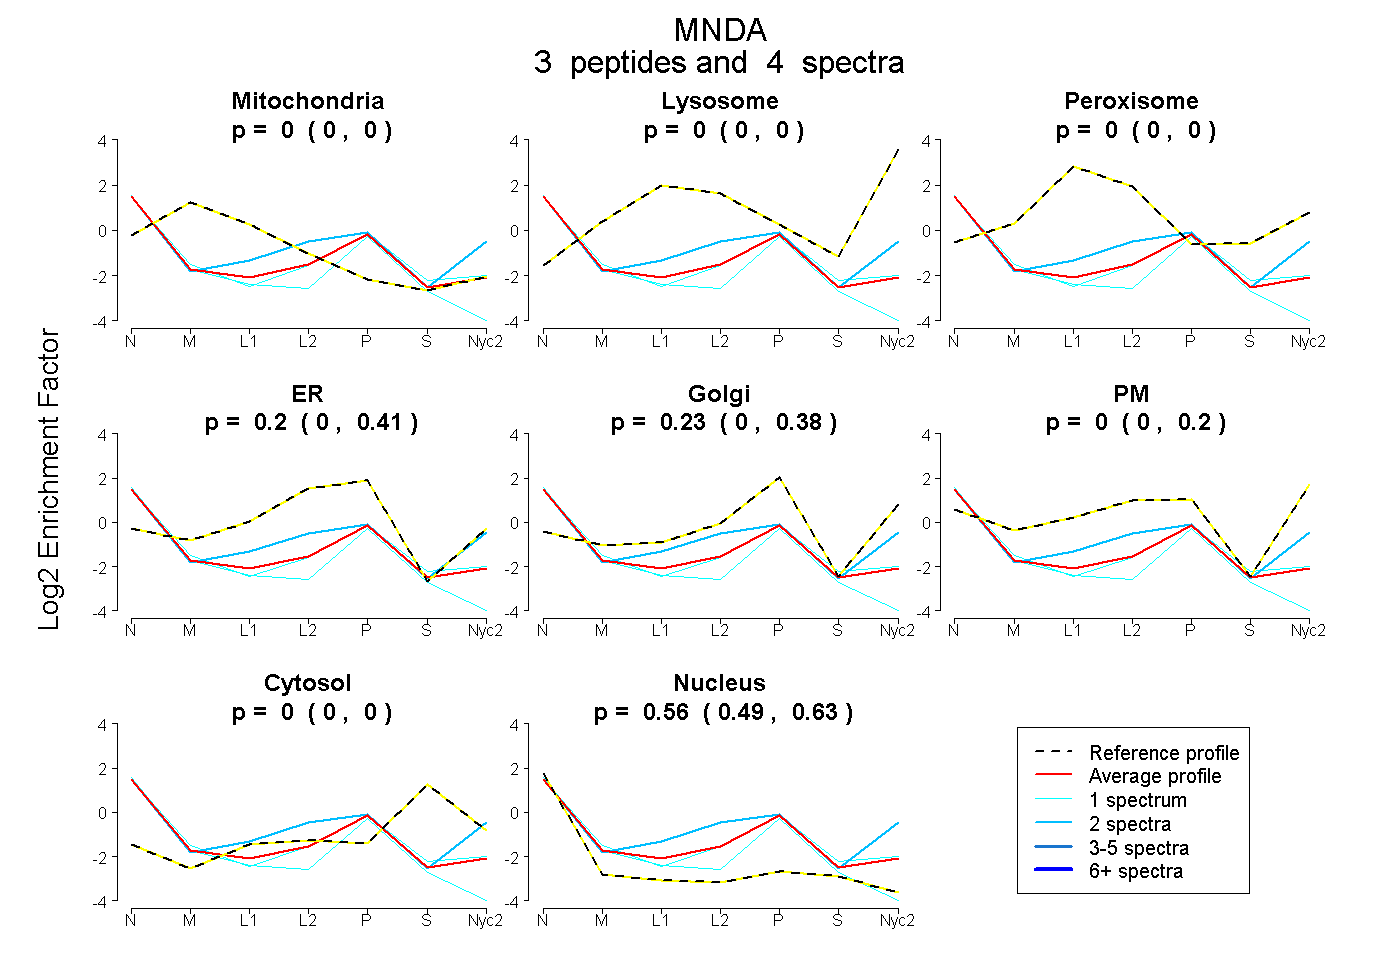
0.000 | 0.000
0.000 | 0.000
0.000 | 0.000
0.000 | 0.407
0.000 | 0.385
0.000 | 0.205
0.000 | 0.000
0.492 | 0.628
| Plot | Mito | Lyso | Perox | ER | Golgi | PM | Cytosol | Nucleus | |||||
| Expt A |
3 peptides |
4 spectra |
|
0.000 0.000 | 0.000 |
0.000 0.000 | 0.000 |
0.000 0.000 | 0.000 |
0.205 0.000 | 0.407 |
0.232 0.000 | 0.385 |
0.001 0.000 | 0.205 |
0.000 0.000 | 0.000 |
0.562 0.492 | 0.628 |
| 1 spectrum, ATDPFEYESAEHGVK | 0.000 | 0.000 | 0.000 | 0.235 | 0.000 | 0.000 | 0.000 | 0.765 | ||
| 1 spectrum, DLFYGVFTLIK | 0.000 | 0.000 | 0.000 | 0.087 | 0.356 | 0.000 | 0.000 | 0.557 | ||
| 2 spectra, NNFIIISNYFK | 0.000 | 0.000 | 0.000 | 0.038 | 0.035 | 0.528 | 0.000 | 0.399 |