 3
3peptides
spectra
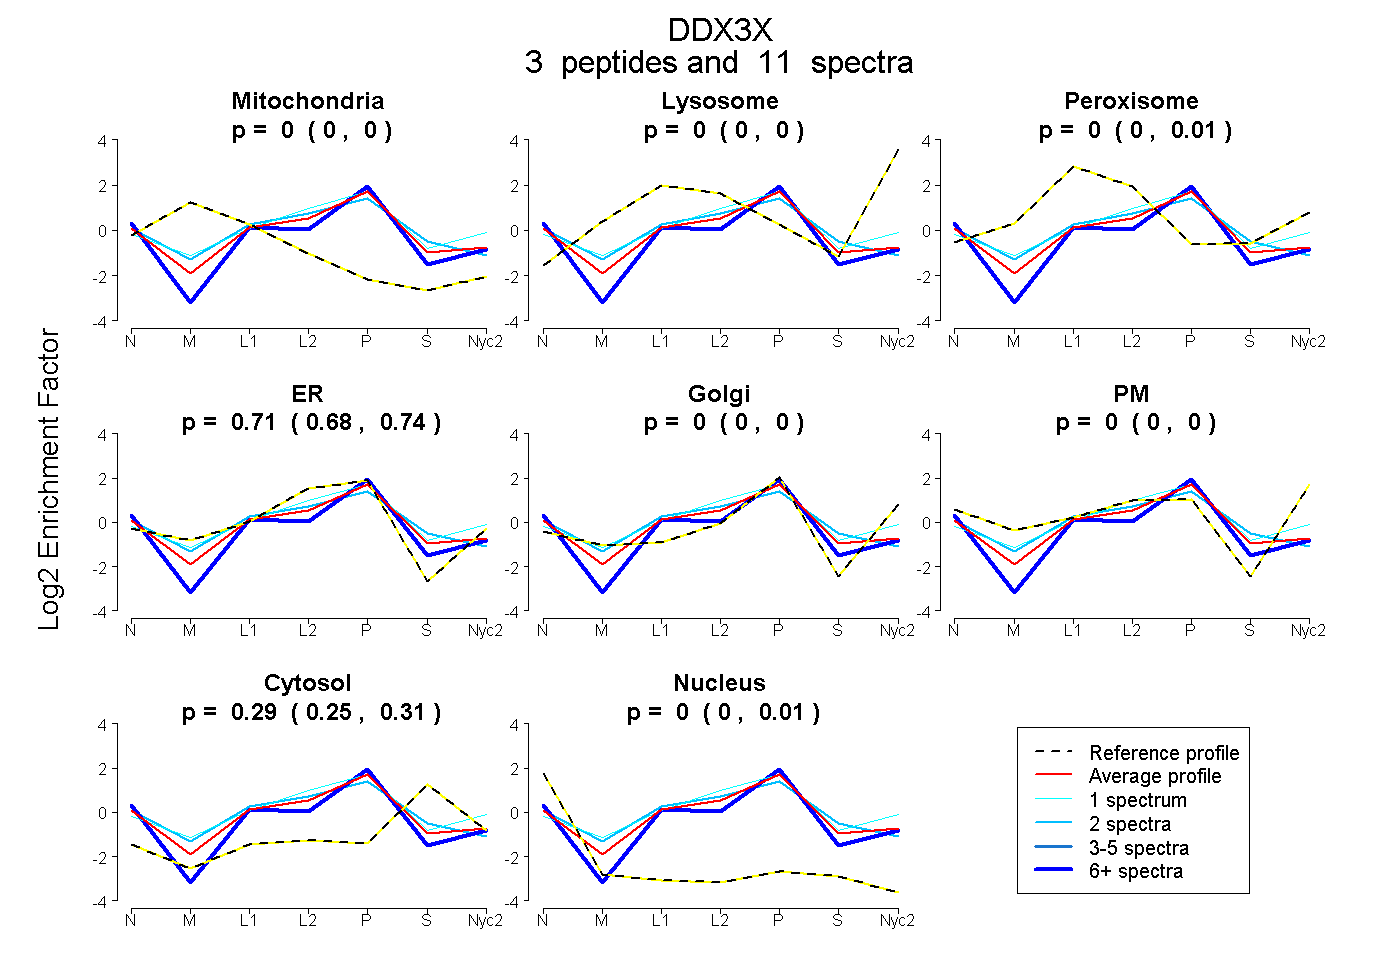
0.000 | 0.000
0.000 | 0.000
0.000 | 0.006
0.681 | 0.736
0.000 | 0.004
0.000 | 0.000
0.254 | 0.311
0.000 | 0.008
1peptide
spectrum
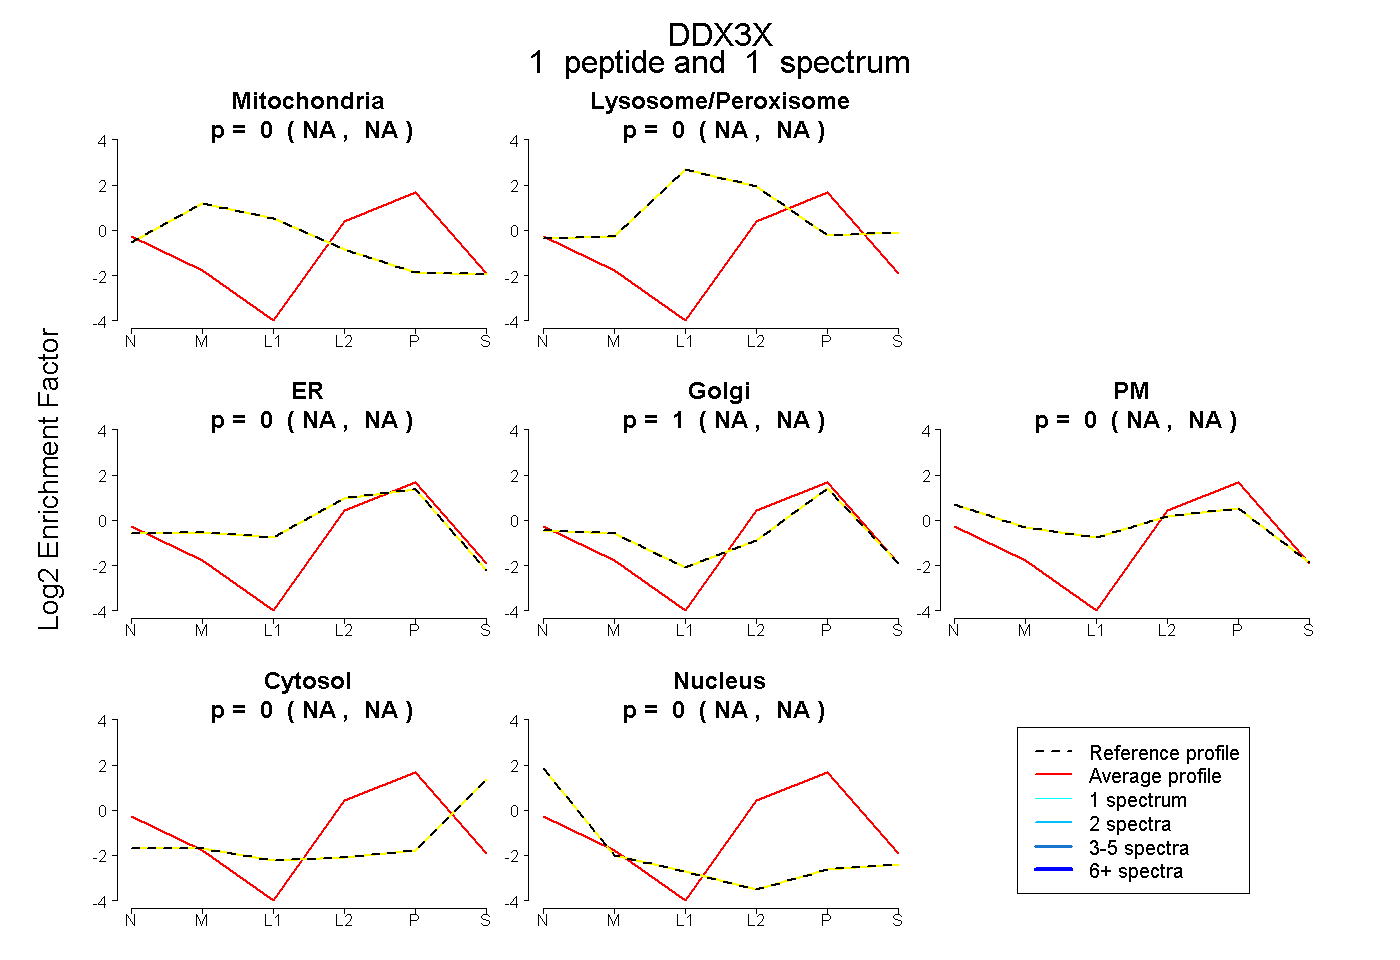
NA | NA
NA | NA
NA | NA
NA | NA
NA | NA
NA | NA
NA | NA
1peptide
spectrum
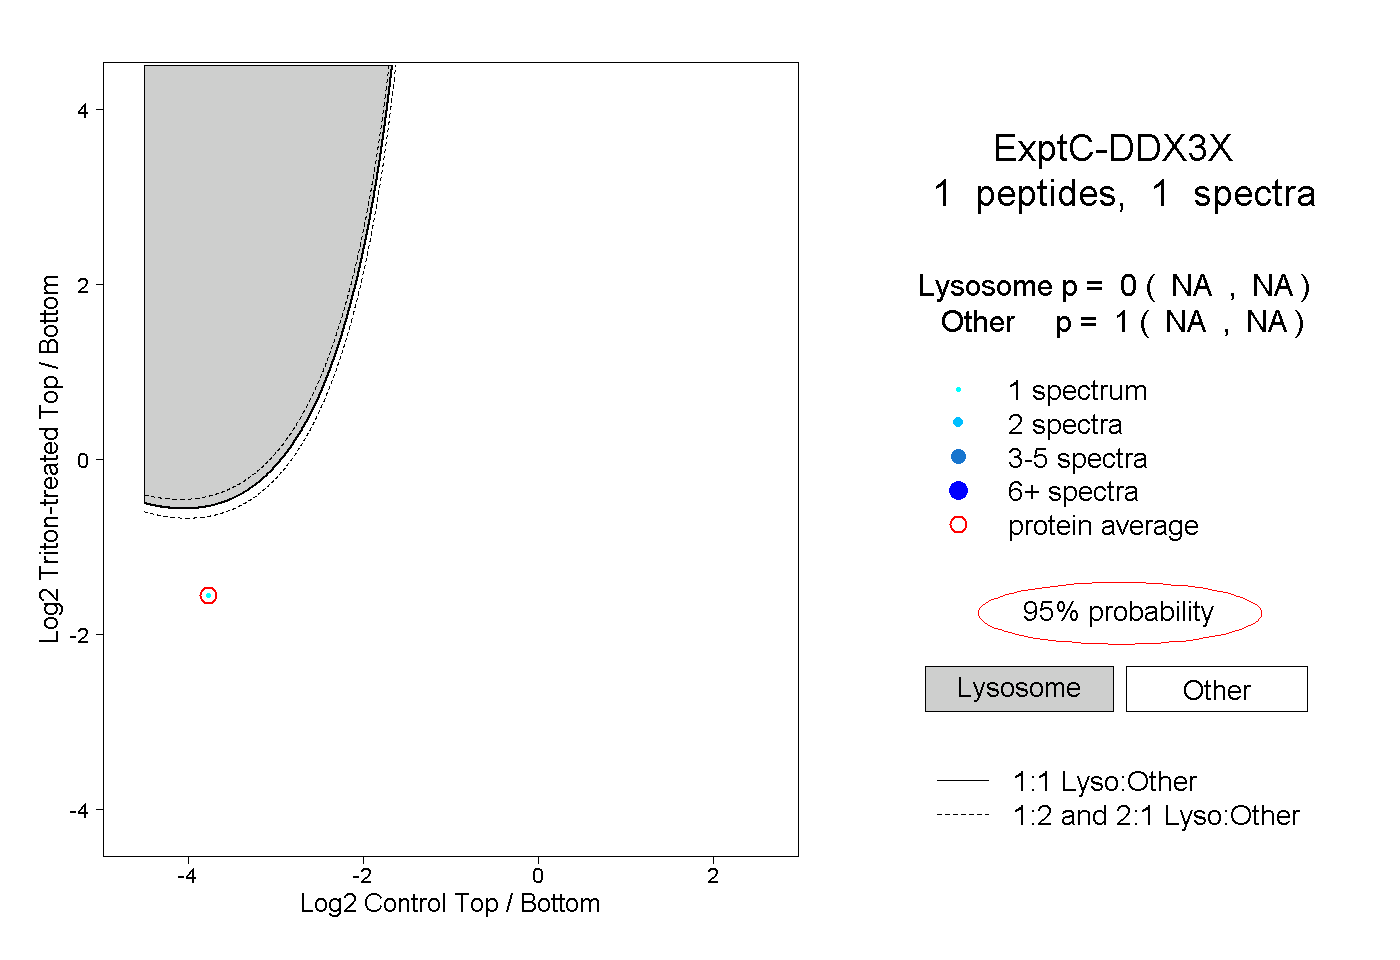
NA | NA
NA | NA