 3
3peptides
spectra
0.000 | 0.000
0.000 | 0.000
0.000 | 0.006
0.681 | 0.736
0.000 | 0.004
0.000 | 0.000
0.254 | 0.311
0.000 | 0.008
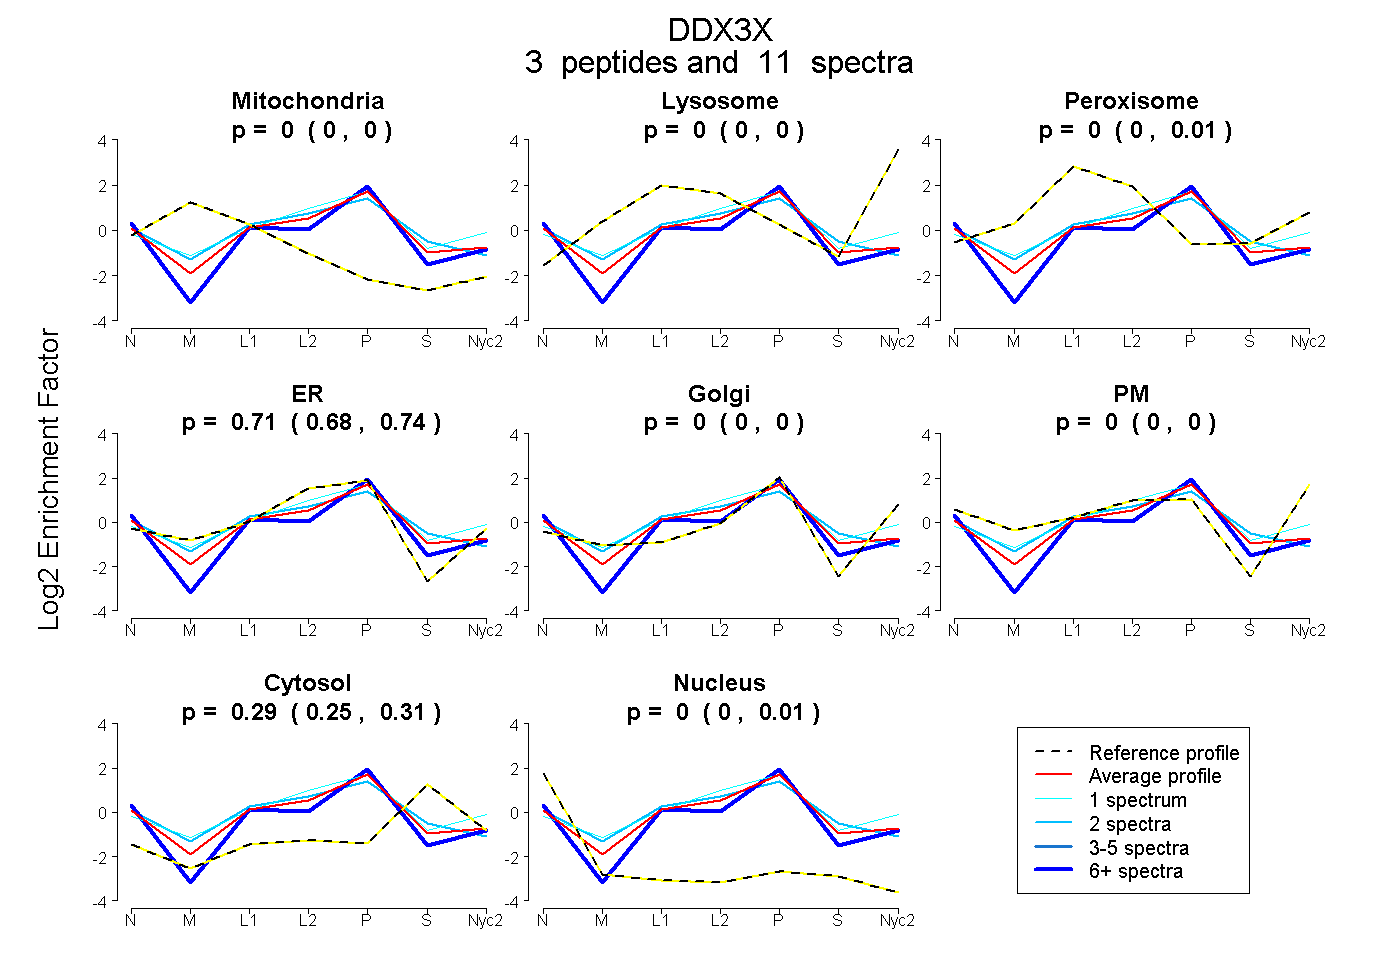
| Plot | Mito | Lyso | Perox | ER | Golgi | PM | Cytosol | Nucleus | |||||
| Expt A |
3 peptides |
11 spectra |
|
0.000 0.000 | 0.000 |
0.000 0.000 | 0.000 |
0.000 0.000 | 0.006 |
0.713 0.681 | 0.736 |
0.000 0.000 | 0.004 |
0.000 0.000 | 0.000 |
0.287 0.254 | 0.311 |
0.000 0.000 | 0.008 |
| 8 spectra, QSSGASSSSFSSSR | 0.000 | 0.000 | 0.000 | 0.569 | 0.142 | 0.000 | 0.206 | 0.084 | ||
| 2 spectra, DSLTLVFVETK | 0.000 | 0.000 | 0.086 | 0.617 | 0.000 | 0.000 | 0.297 | 0.000 | ||
| 1 spectrum, VVWVEEIDK | 0.000 | 0.000 | 0.124 | 0.564 | 0.123 | 0.000 | 0.190 | 0.000 |
| Plot | Mito | Lyso or Perox | ER | Golgi | PM | Cytosol | Nucleus | ||||||
| Expt B |
1 peptide |
1 spectrum |
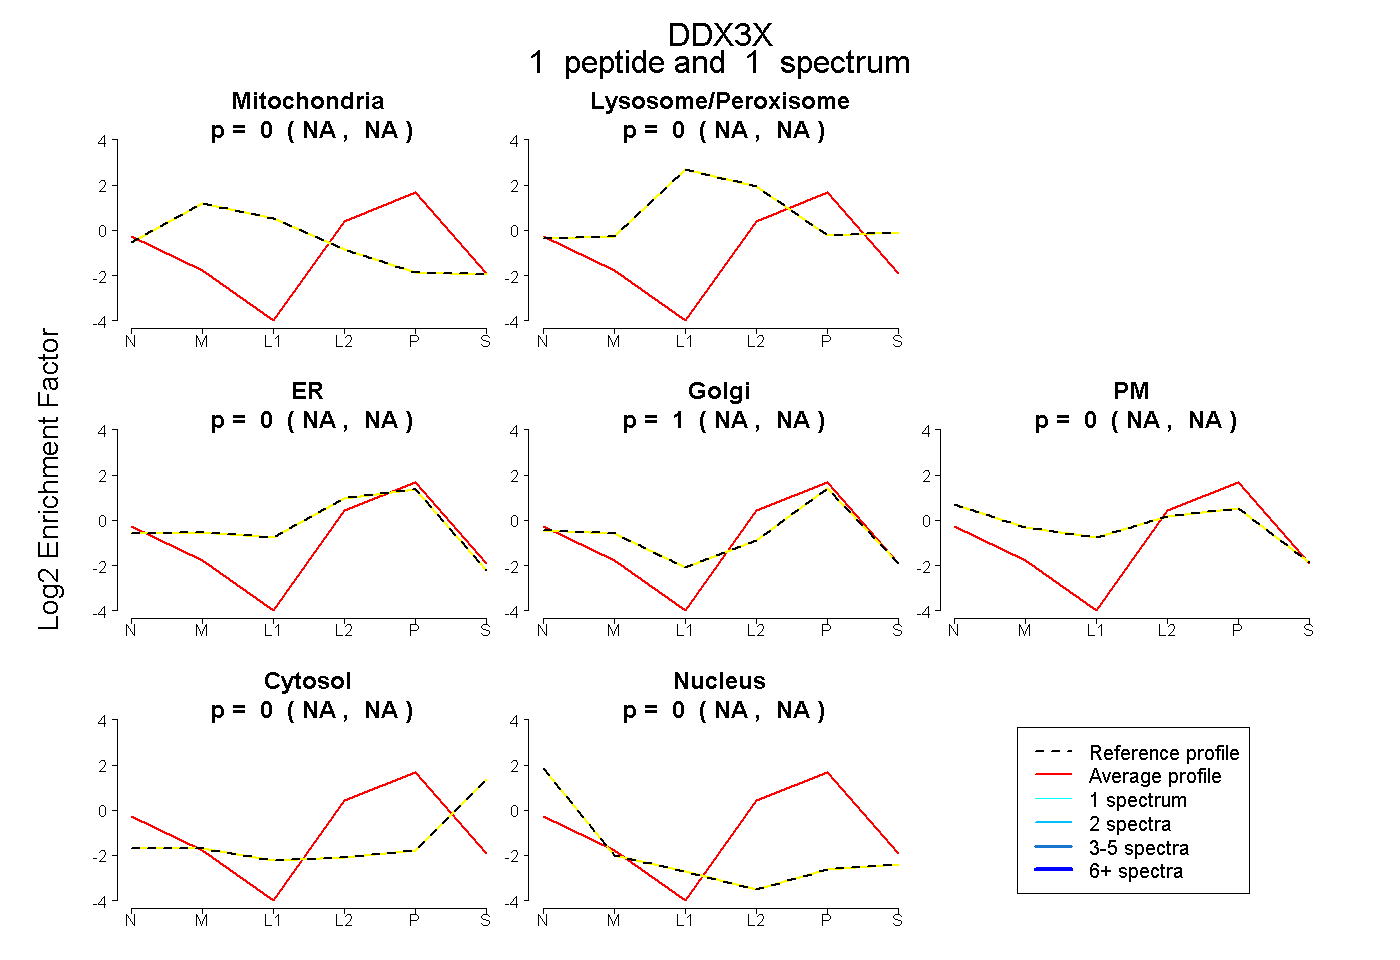 |
0.000 NA | NA |
0.000 NA | NA |
0.000 NA | NA |
1.000 NA | NA |
0.000 NA | NA |
0.000 NA | NA |
0.000 NA | NA |
|||
| Plot | Lyso | Other | |||||||||||
| Expt C |
1 peptide |
1 spectrum |
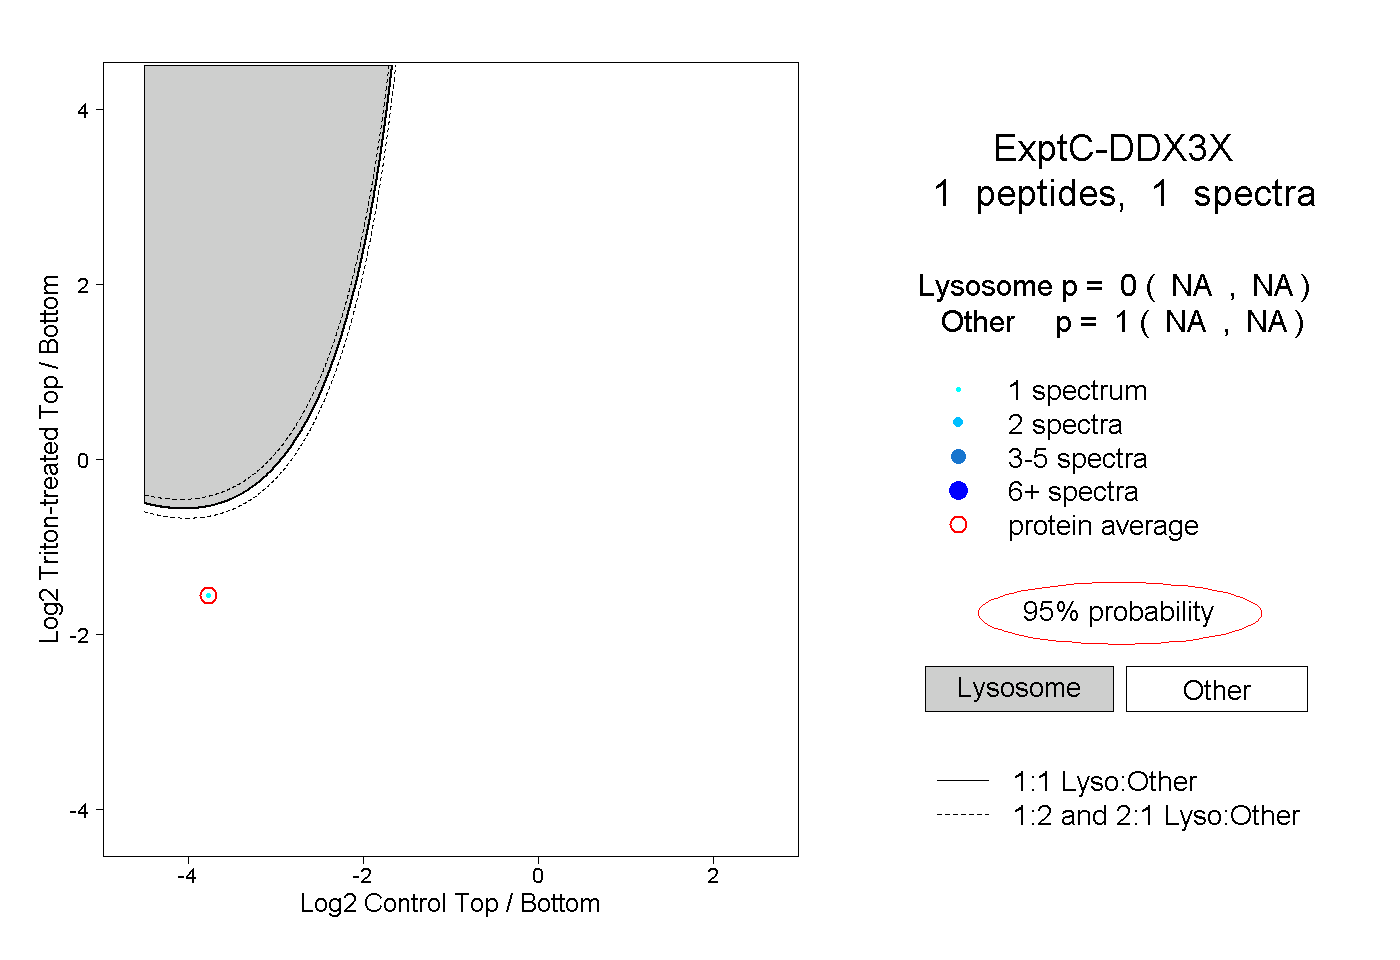 |
0.000 NA | NA |
1.000 NA | NA |