 3
3peptides
spectra
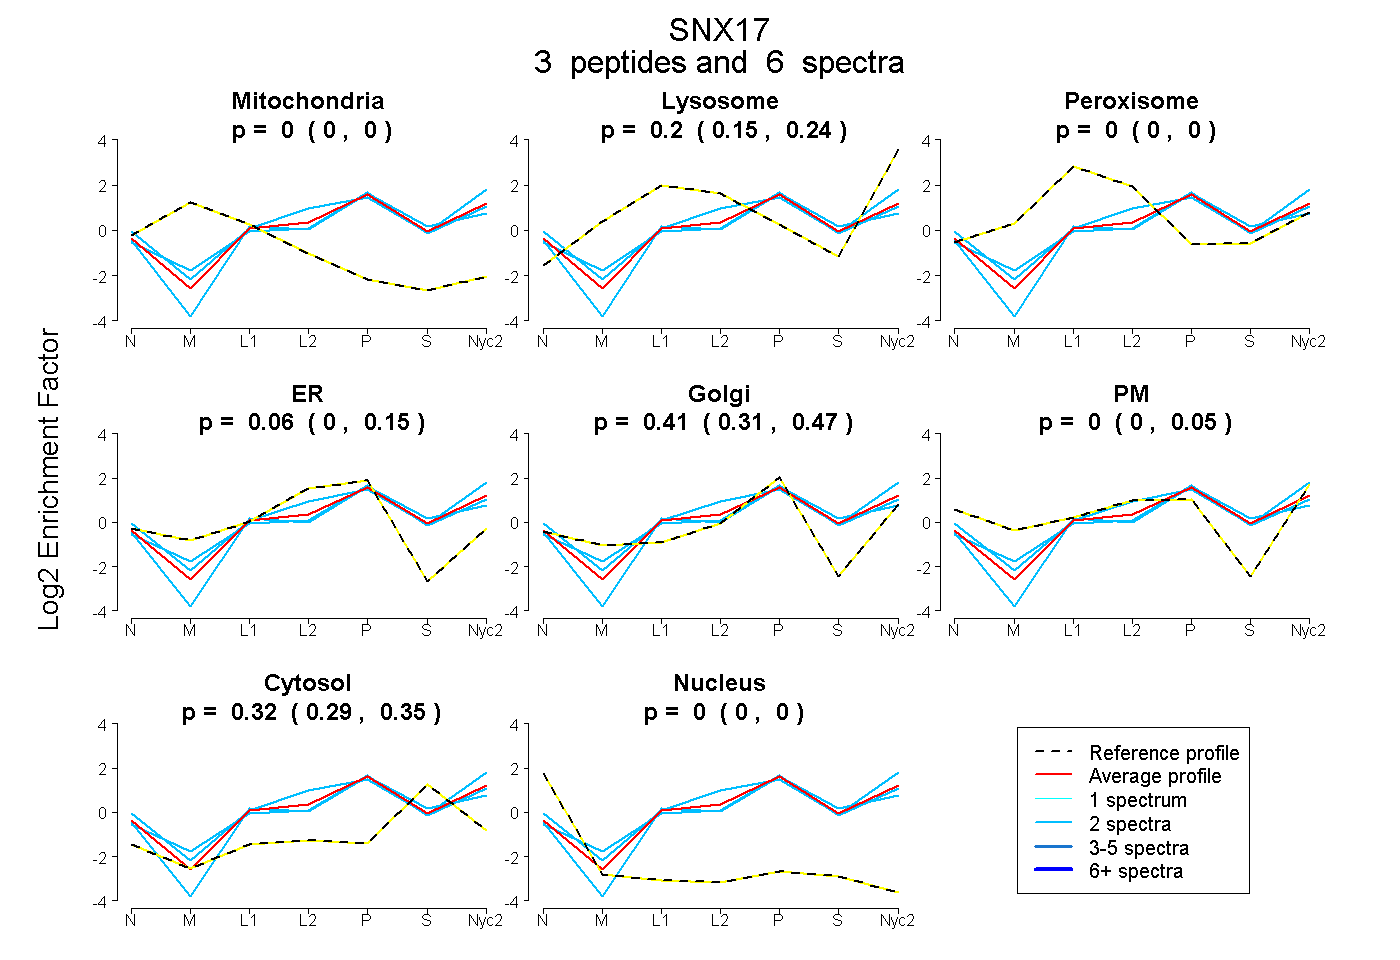
0.000 | 0.000
0.153 | 0.240
0.000 | 0.000
0.000 | 0.148
0.314 | 0.471
0.000 | 0.047
0.287 | 0.351
0.000 | 0.000
2peptides
spectra
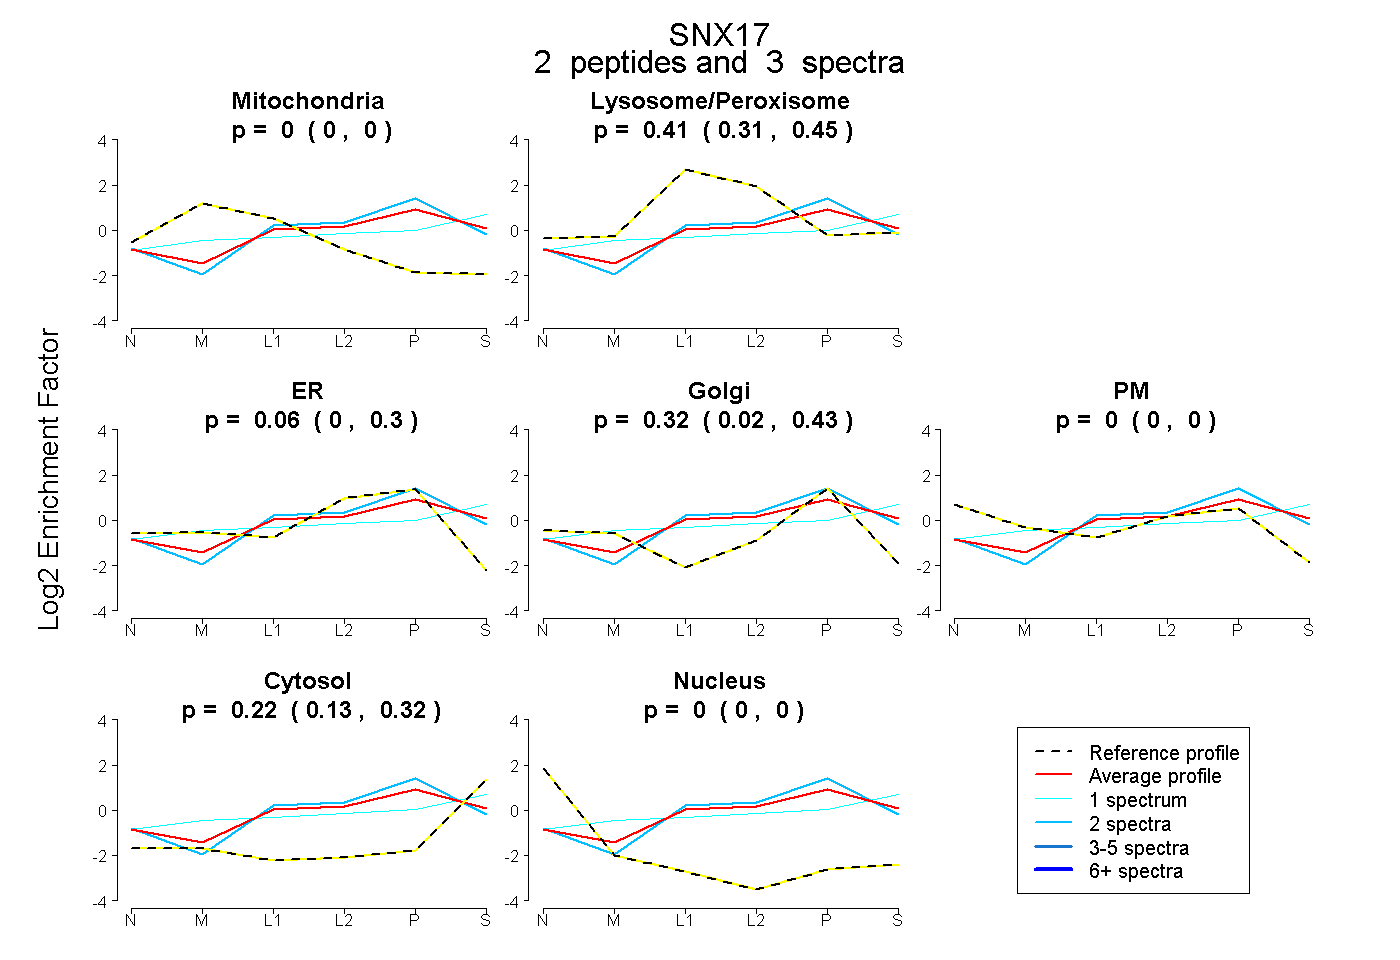
0.000 | 0.000
0.305 | 0.454
0.000 | 0.301
0.016 | 0.430
0.000 | 0.000
0.130 | 0.317
0.000 | 0.000
7peptides
spectra
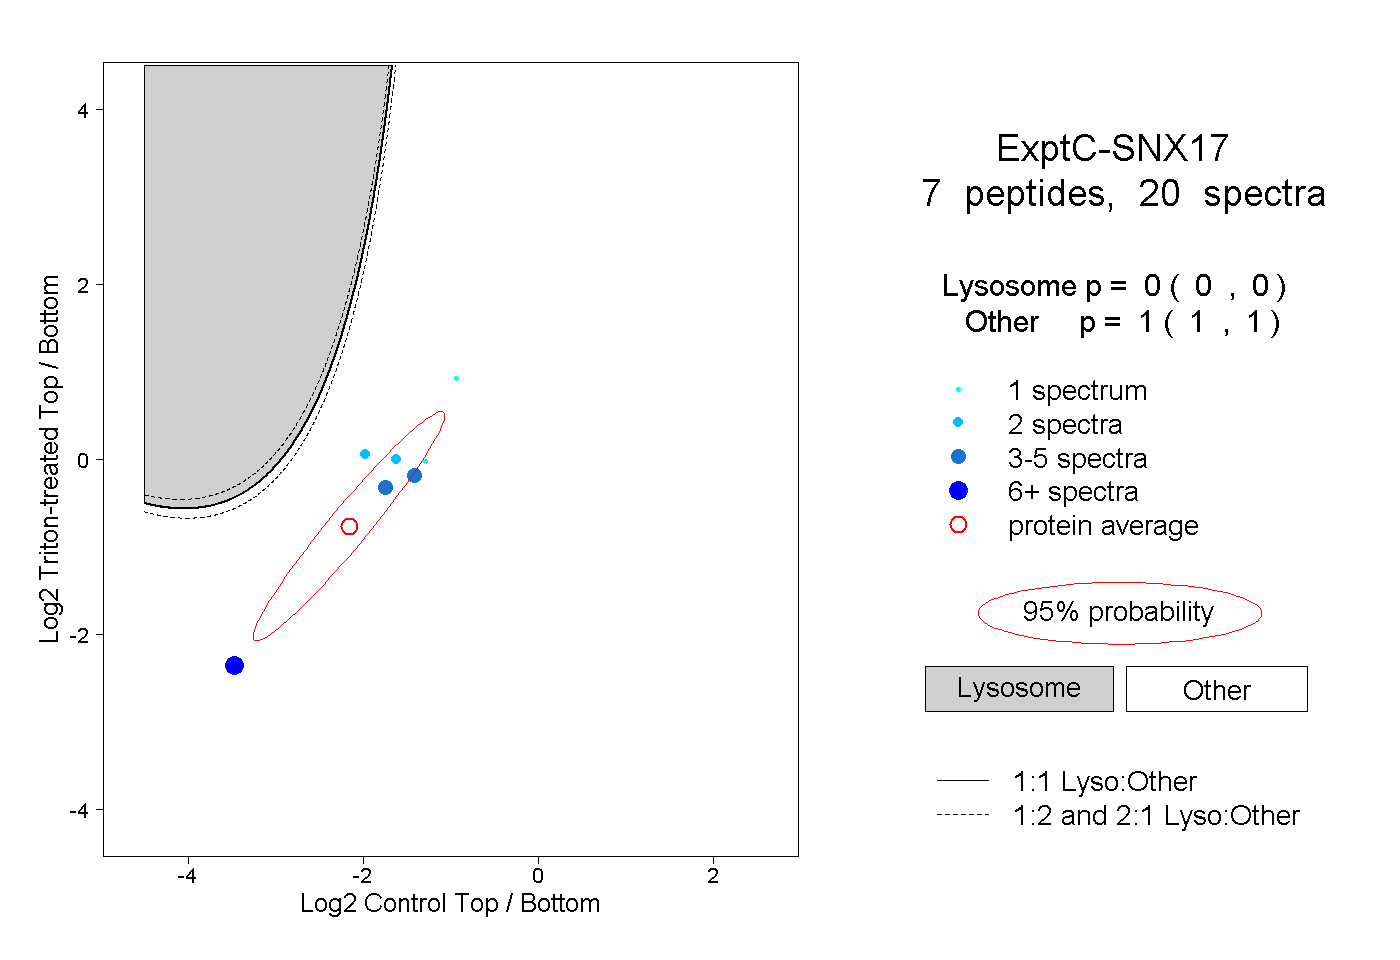
0.000 | 0.000
1.000 | 1.000
1peptide
spectra
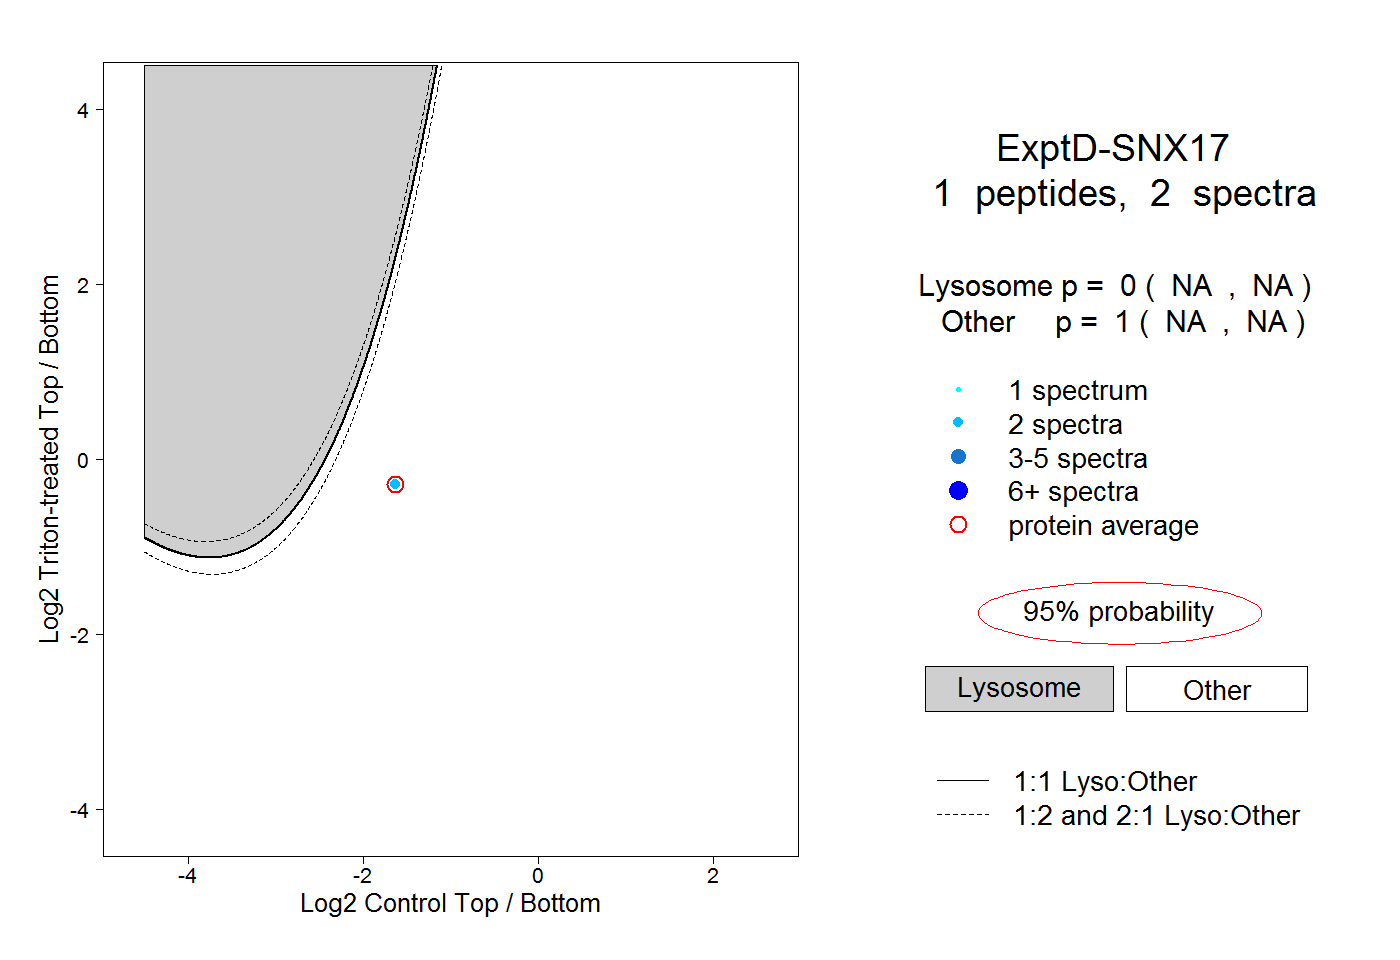
NA | NA
NA | NA