 2
2peptides
spectra
NA | NA
NA | NA
NA | NA
NA | NA
NA | NA
NA | NA
NA | NA
NA | NA
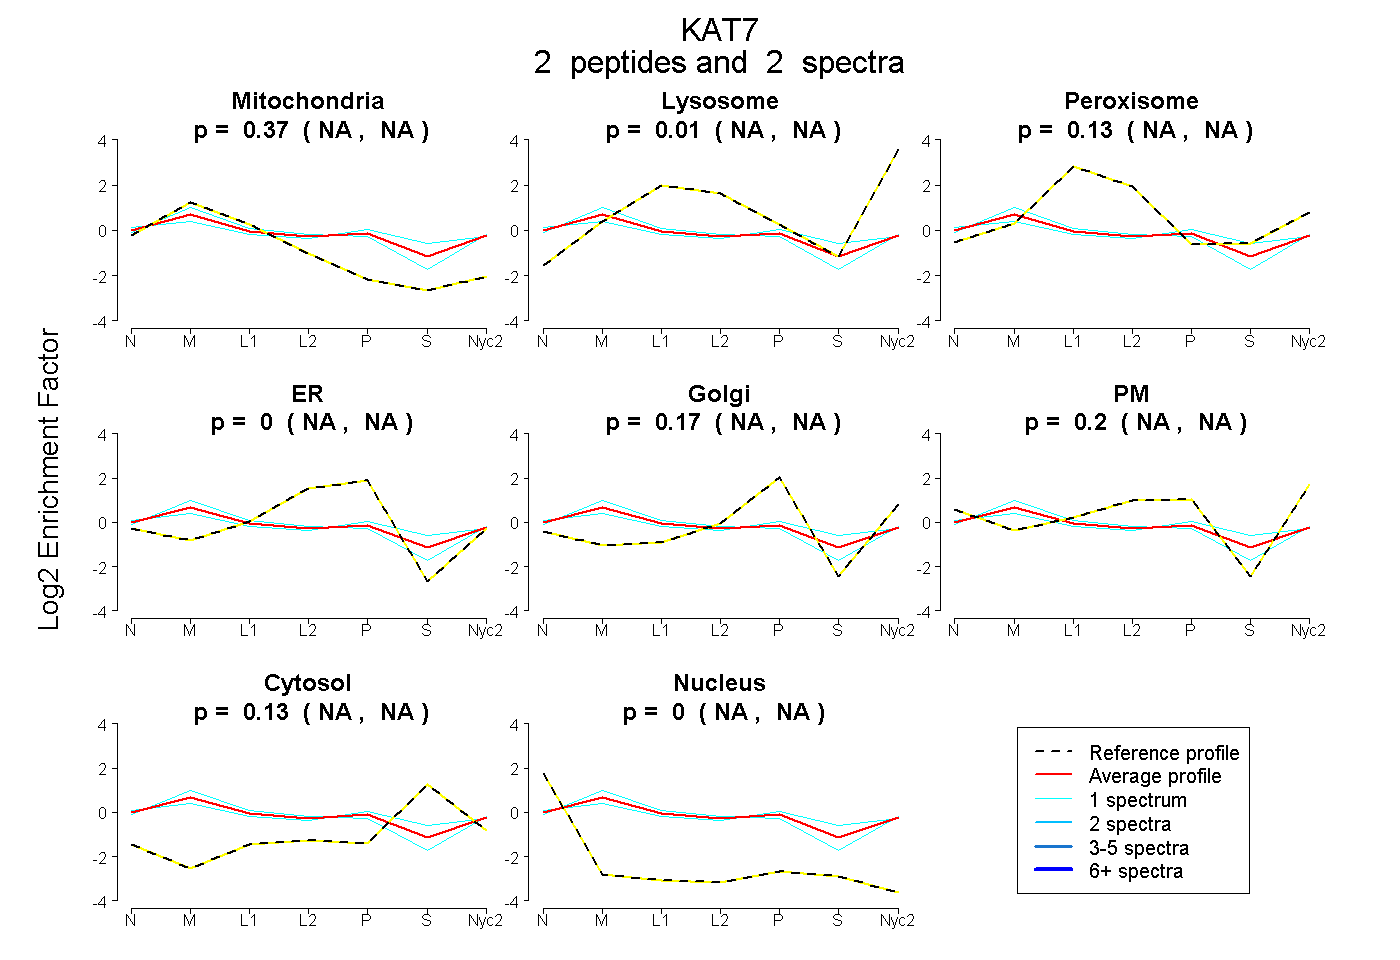
| Plot | Mito | Lyso | Perox | ER | Golgi | PM | Cytosol | Nucleus | |||||
| Expt A |
2 peptides |
2 spectra |
|
0.367 NA | NA |
0.011 NA | NA |
0.128 NA | NA |
0.000 NA | NA |
0.173 NA | NA |
0.196 NA | NA |
0.125 NA | NA |
0.000 NA | NA |
| 1 spectrum, TIAFGR | 0.489 | 0.106 | 0.052 | 0.000 | 0.186 | 0.149 | 0.019 | 0.000 | ||
| 1 spectrum, QDLIDEWIAK | 0.270 | 0.000 | 0.136 | 0.000 | 0.154 | 0.207 | 0.233 | 0.000 |