 36
36peptides
spectra
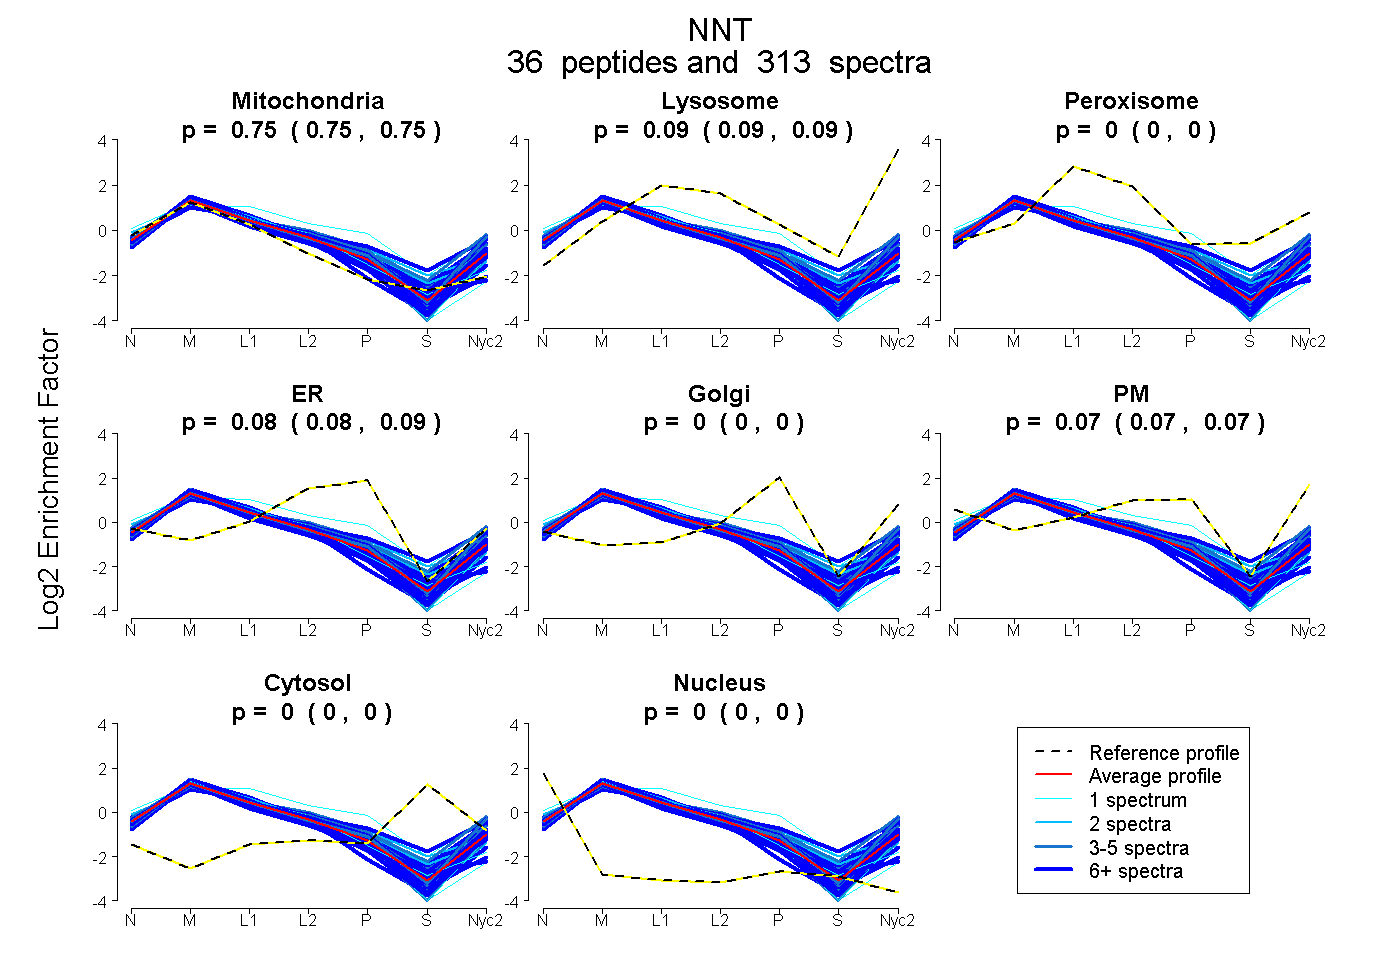
0.751 | 0.753
0.091 | 0.094
0.000 | 0.000
0.081 | 0.087
0.000 | 0.000
0.068 | 0.074
0.000 | 0.000
0.000 | 0.000
33peptides
spectra
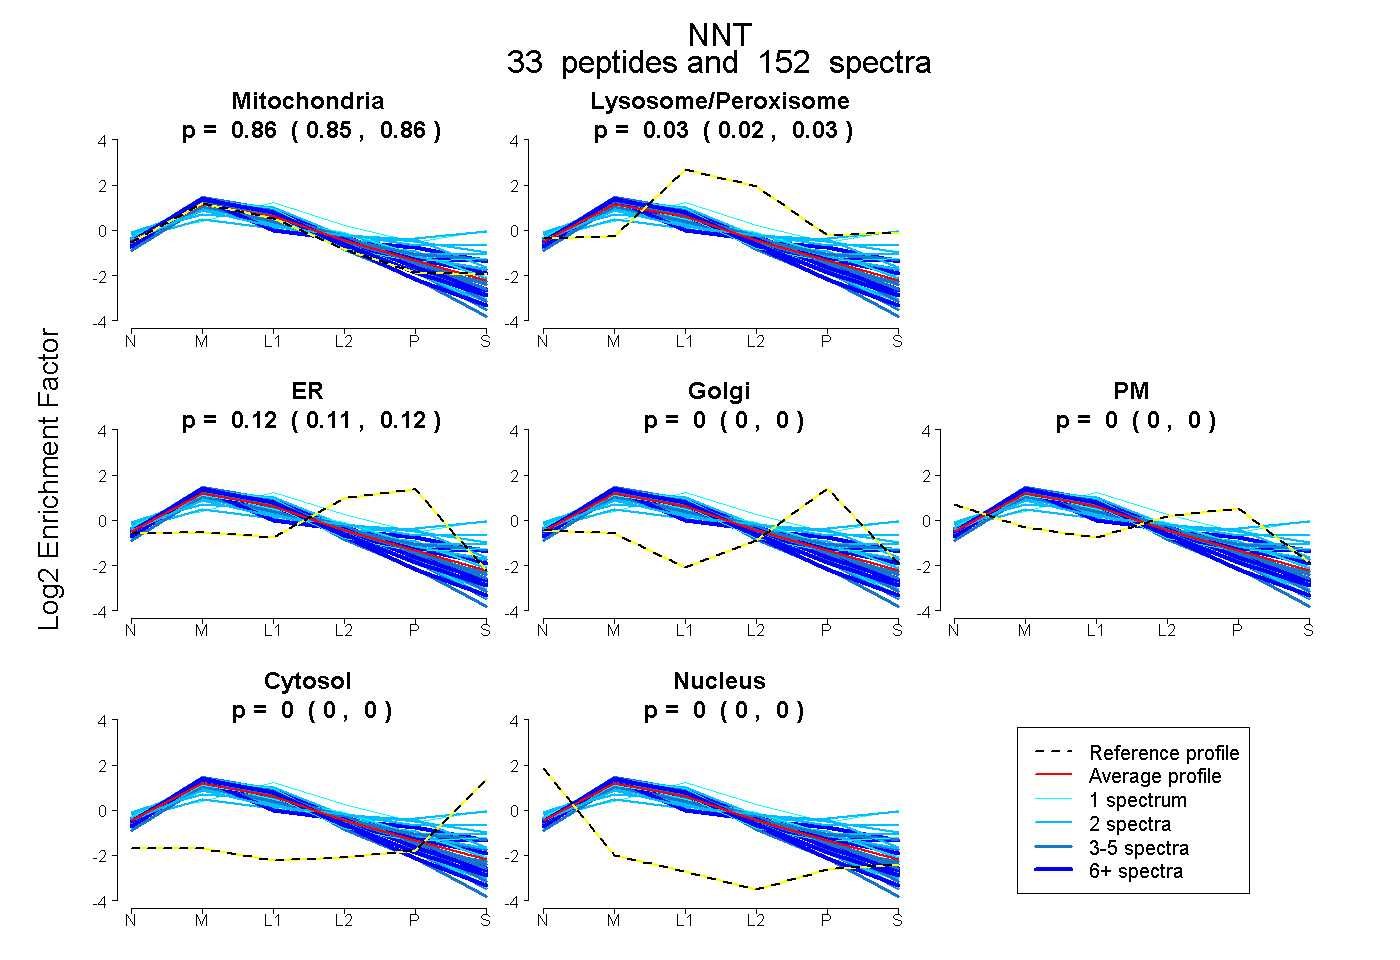
0.855 | 0.860
0.022 | 0.028
0.114 | 0.120
0.000 | 0.000
0.000 | 0.000
0.000 | 0.000
0.000 | 0.000
40peptides
spectra
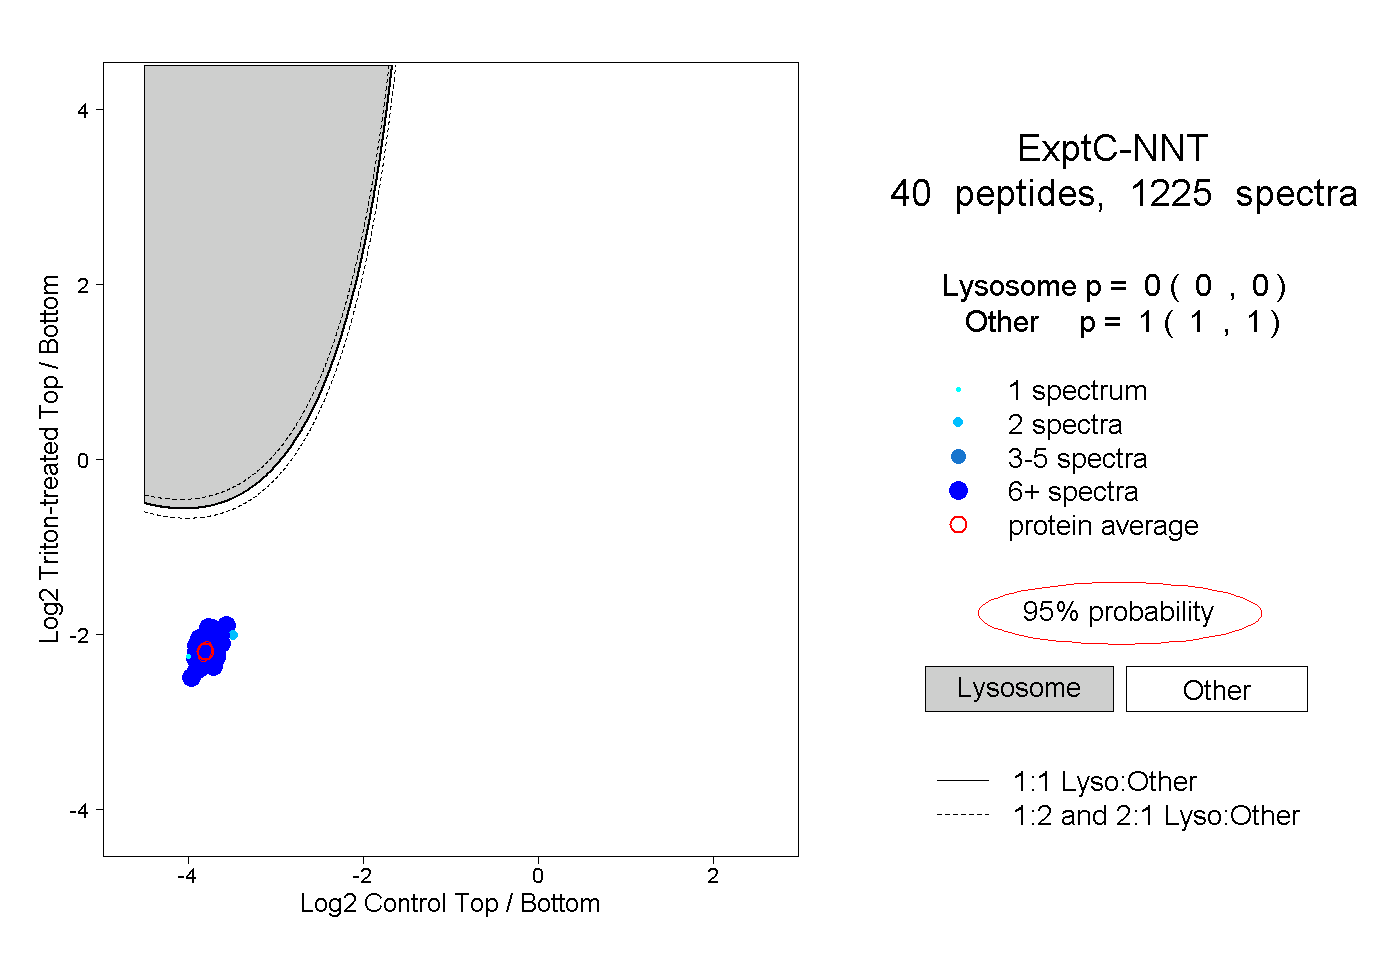
0.000 | 0.000
1.000 | 1.000
21peptides
spectra
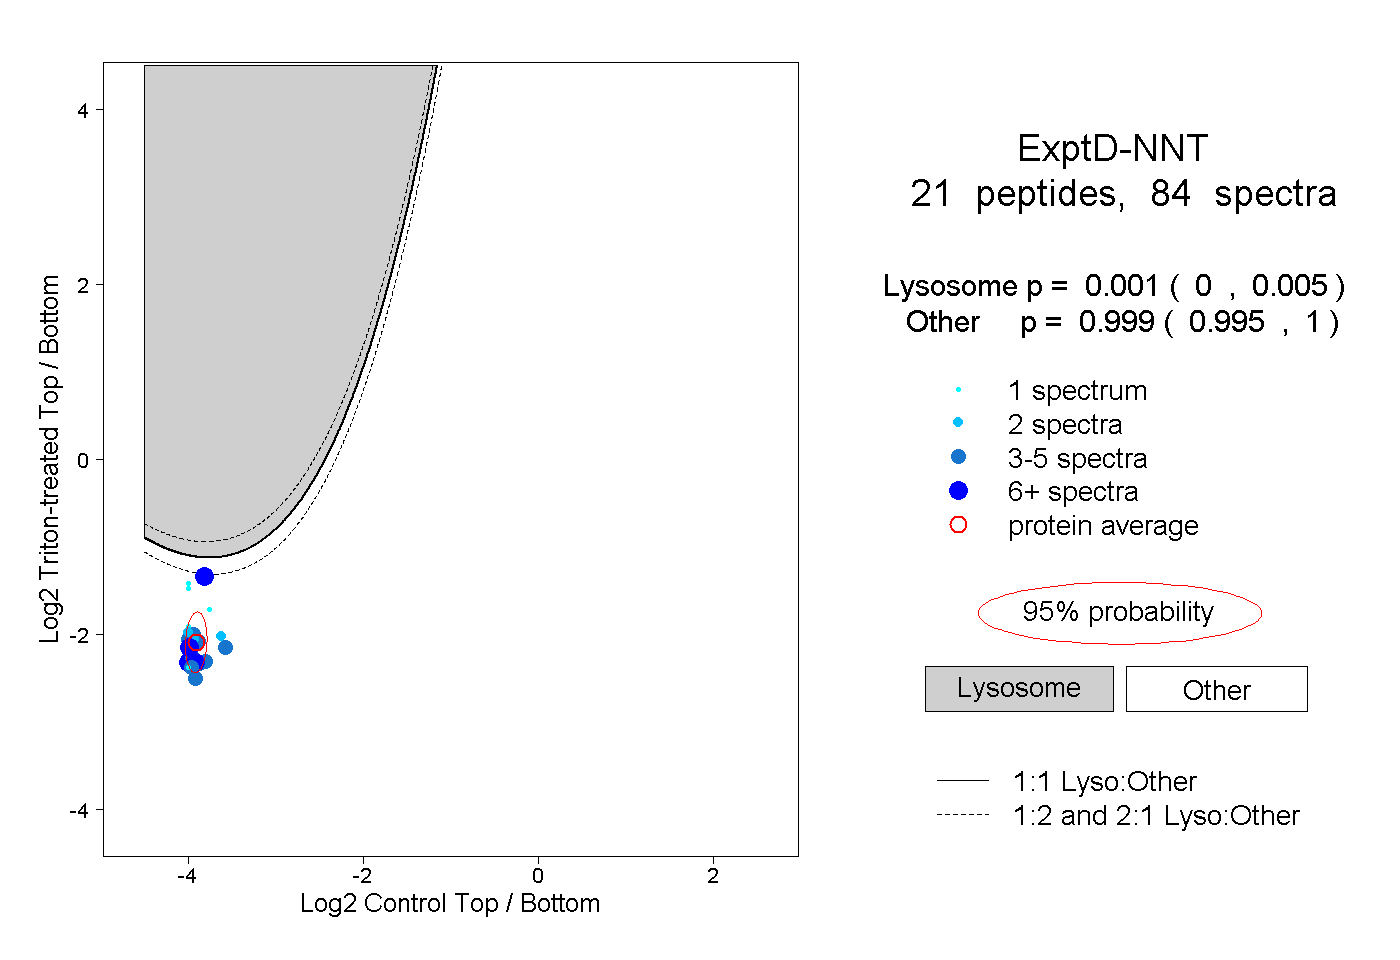
0.000 | 0.005
0.995 | 1.000