 36
36peptides
spectra
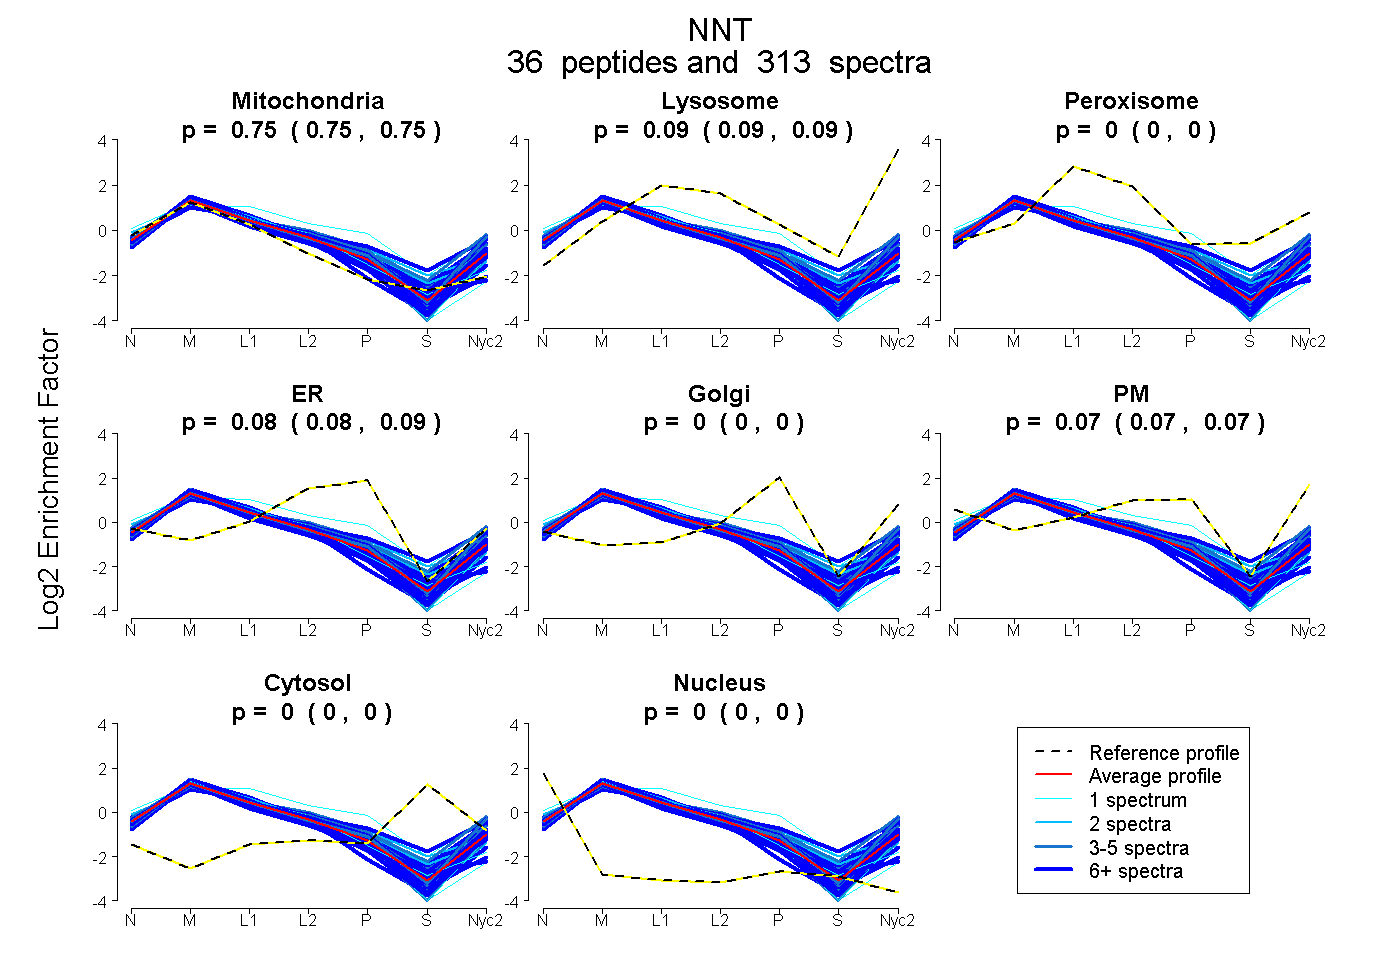
0.751 | 0.753
0.091 | 0.094
0.000 | 0.000
0.081 | 0.087
0.000 | 0.000
0.068 | 0.074
0.000 | 0.000
0.000 | 0.000
| Plot | Mito | Lyso | Perox | ER | Golgi | PM | Cytosol | Nucleus | |||||
| Expt A |
36 peptides |
313 spectra |
|
0.752 0.751 | 0.753 |
0.092 0.091 | 0.094 |
0.000 0.000 | 0.000 |
0.084 0.081 | 0.087 |
0.000 0.000 | 0.000 |
0.071 0.068 | 0.074 |
0.000 0.000 | 0.000 |
0.000 0.000 | 0.000 |
| 5 spectra, FPDDLYR | 0.848 | 0.025 | 0.000 | 0.000 | 0.000 | 0.127 | 0.000 | 0.000 | ||
| 2 spectra, EVDILISTALIPGK | 0.654 | 0.000 | 0.143 | 0.040 | 0.163 | 0.000 | 0.000 | 0.000 | ||
| 4 spectra, MLTEQGK | 0.723 | 0.150 | 0.000 | 0.083 | 0.044 | 0.000 | 0.000 | 0.000 | ||
| 16 spectra, AAALEQFK | 0.697 | 0.099 | 0.000 | 0.111 | 0.000 | 0.093 | 0.000 | 0.000 | ||
| 3 spectra, VTIAQGYDALSSMANISGYK | 0.662 | 0.130 | 0.000 | 0.000 | 0.000 | 0.208 | 0.000 | 0.000 | ||
| 4 spectra, AQYPIADLVK | 0.627 | 0.123 | 0.000 | 0.115 | 0.007 | 0.128 | 0.000 | 0.000 | ||
| 34 spectra, SAPLLLPGR | 0.832 | 0.069 | 0.000 | 0.000 | 0.000 | 0.099 | 0.000 | 0.000 | ||
| 4 spectra, QLTVGVPK | 0.662 | 0.072 | 0.000 | 0.070 | 0.000 | 0.196 | 0.000 | 0.000 | ||
| 48 spectra, SMGAVVR | 0.776 | 0.073 | 0.000 | 0.071 | 0.000 | 0.079 | 0.000 | 0.000 | ||
| 5 spectra, EVLASDLVVK | 0.649 | 0.034 | 0.000 | 0.138 | 0.000 | 0.180 | 0.000 | 0.000 | ||
| 3 spectra, ESGEGQGGYAK | 0.841 | 0.041 | 0.000 | 0.006 | 0.000 | 0.112 | 0.000 | 0.000 | ||
| 9 spectra, VALSPAGVQALVK | 0.651 | 0.132 | 0.000 | 0.000 | 0.000 | 0.217 | 0.000 | 0.000 | ||
| 12 spectra, TTVLAMDQVPR | 0.777 | 0.106 | 0.000 | 0.000 | 0.000 | 0.117 | 0.000 | 0.000 | ||
| 7 spectra, AGTVSMYTK | 0.683 | 0.144 | 0.000 | 0.000 | 0.000 | 0.173 | 0.000 | 0.000 | ||
| 15 spectra, GITHIGYTDLPSR | 0.555 | 0.134 | 0.147 | 0.000 | 0.161 | 0.000 | 0.003 | 0.000 | ||
| 18 spectra, AVVLAANHFGR | 0.707 | 0.047 | 0.000 | 0.171 | 0.000 | 0.075 | 0.000 | 0.000 | ||
| 6 spectra, AAGAQIQGTK | 0.742 | 0.117 | 0.000 | 0.028 | 0.000 | 0.113 | 0.000 | 0.000 | ||
| 35 spectra, FGIHPVAGR | 0.712 | 0.041 | 0.000 | 0.180 | 0.000 | 0.066 | 0.000 | 0.000 | ||
| 6 spectra, DDFDFGTMSHVIR | 0.771 | 0.194 | 0.000 | 0.000 | 0.035 | 0.000 | 0.000 | 0.000 | ||
| 1 spectrum, EIFQNEK | 0.901 | 0.000 | 0.000 | 0.099 | 0.000 | 0.000 | 0.000 | 0.000 | ||
| 1 spectrum, FFTGQITAAGK | 0.789 | 0.025 | 0.000 | 0.000 | 0.000 | 0.186 | 0.000 | 0.000 | ||
| 7 spectra, LFAQQCK | 0.845 | 0.000 | 0.000 | 0.155 | 0.000 | 0.000 | 0.000 | 0.000 | ||
| 2 spectra, MATQASTLYSNNITK | 0.825 | 0.128 | 0.000 | 0.047 | 0.000 | 0.000 | 0.000 | 0.000 | ||
| 1 spectrum, DGNVIFPAPTPK | 0.814 | 0.000 | 0.000 | 0.000 | 0.000 | 0.186 | 0.000 | 0.000 | ||
| 8 spectra, TCDALQAK | 0.874 | 0.000 | 0.000 | 0.126 | 0.000 | 0.000 | 0.000 | 0.000 | ||
| 10 spectra, MLDMFK | 0.787 | 0.136 | 0.000 | 0.044 | 0.000 | 0.034 | 0.000 | 0.000 | ||
| 6 spectra, SLGAEPLEVDLK | 0.761 | 0.062 | 0.000 | 0.130 | 0.000 | 0.047 | 0.000 | 0.000 | ||
| 4 spectra, ILIVGGGVAGLASAGAAK | 0.778 | 0.053 | 0.000 | 0.000 | 0.000 | 0.169 | 0.000 | 0.000 | ||
| 18 spectra, EFIEAEMK | 0.921 | 0.067 | 0.000 | 0.012 | 0.000 | 0.000 | 0.000 | 0.000 | ||
| 2 spectra, EANSIVITPGYGLCAAK | 0.700 | 0.000 | 0.092 | 0.125 | 0.021 | 0.061 | 0.000 | 0.000 | ||
| 2 spectra, DNFHFEVK | 0.728 | 0.000 | 0.000 | 0.242 | 0.000 | 0.029 | 0.000 | 0.000 | ||
| 1 spectrum, APVLFSK | 0.449 | 0.198 | 0.133 | 0.221 | 0.000 | 0.000 | 0.000 | 0.000 | ||
| 4 spectra, QGFNVVVESGAGEASK | 0.629 | 0.209 | 0.000 | 0.000 | 0.037 | 0.125 | 0.000 | 0.000 | ||
| 1 spectrum, TVAELEAEK | 0.811 | 0.000 | 0.065 | 0.124 | 0.000 | 0.000 | 0.000 | 0.000 | ||
| 8 spectra, EMIESMK | 0.785 | 0.182 | 0.000 | 0.023 | 0.000 | 0.009 | 0.000 | 0.000 | ||
| 1 spectrum, LQGILK | 0.813 | 0.000 | 0.000 | 0.051 | 0.000 | 0.136 | 0.000 | 0.000 |
| Plot | Mito | Lyso or Perox | ER | Golgi | PM | Cytosol | Nucleus | ||||||
| Expt B |
33 peptides |
152 spectra |
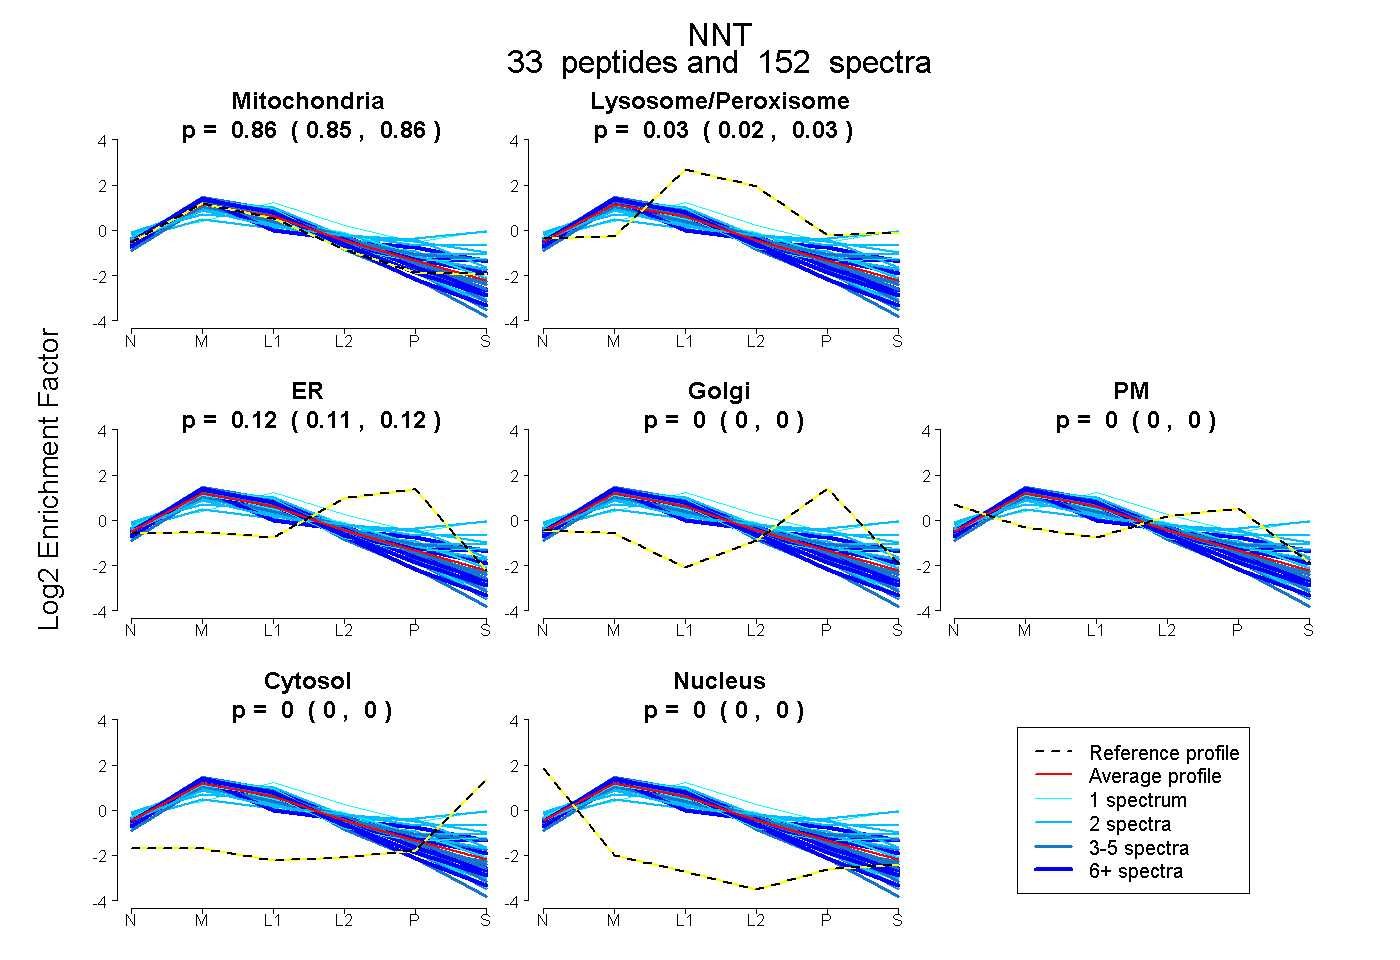 |
0.857 0.855 | 0.860 |
0.025 0.022 | 0.028 |
0.117 0.114 | 0.120 |
0.000 0.000 | 0.000 |
0.000 0.000 | 0.000 |
0.000 0.000 | 0.000 |
0.000 0.000 | 0.000 |
|||
| Plot | Lyso | Other | |||||||||||
| Expt C |
40 peptides |
1225 spectra |
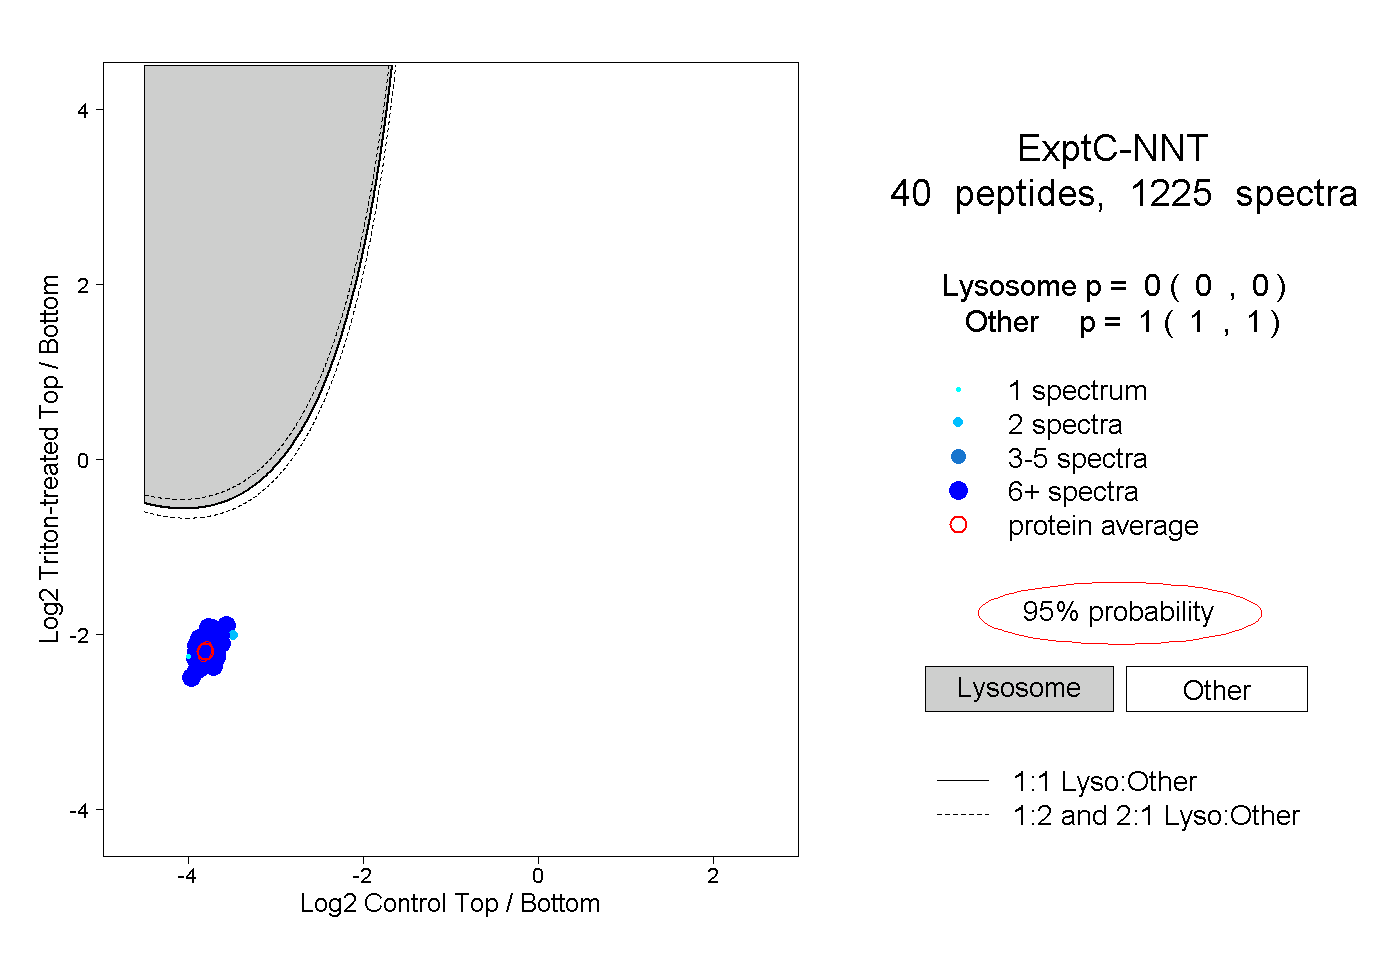 |
0.000 0.000 | 0.000 |
1.000 1.000 | 1.000 |
||||||||
| Plot | Lyso | Other | |||||||||||
| Expt D |
21 peptides |
84 spectra |
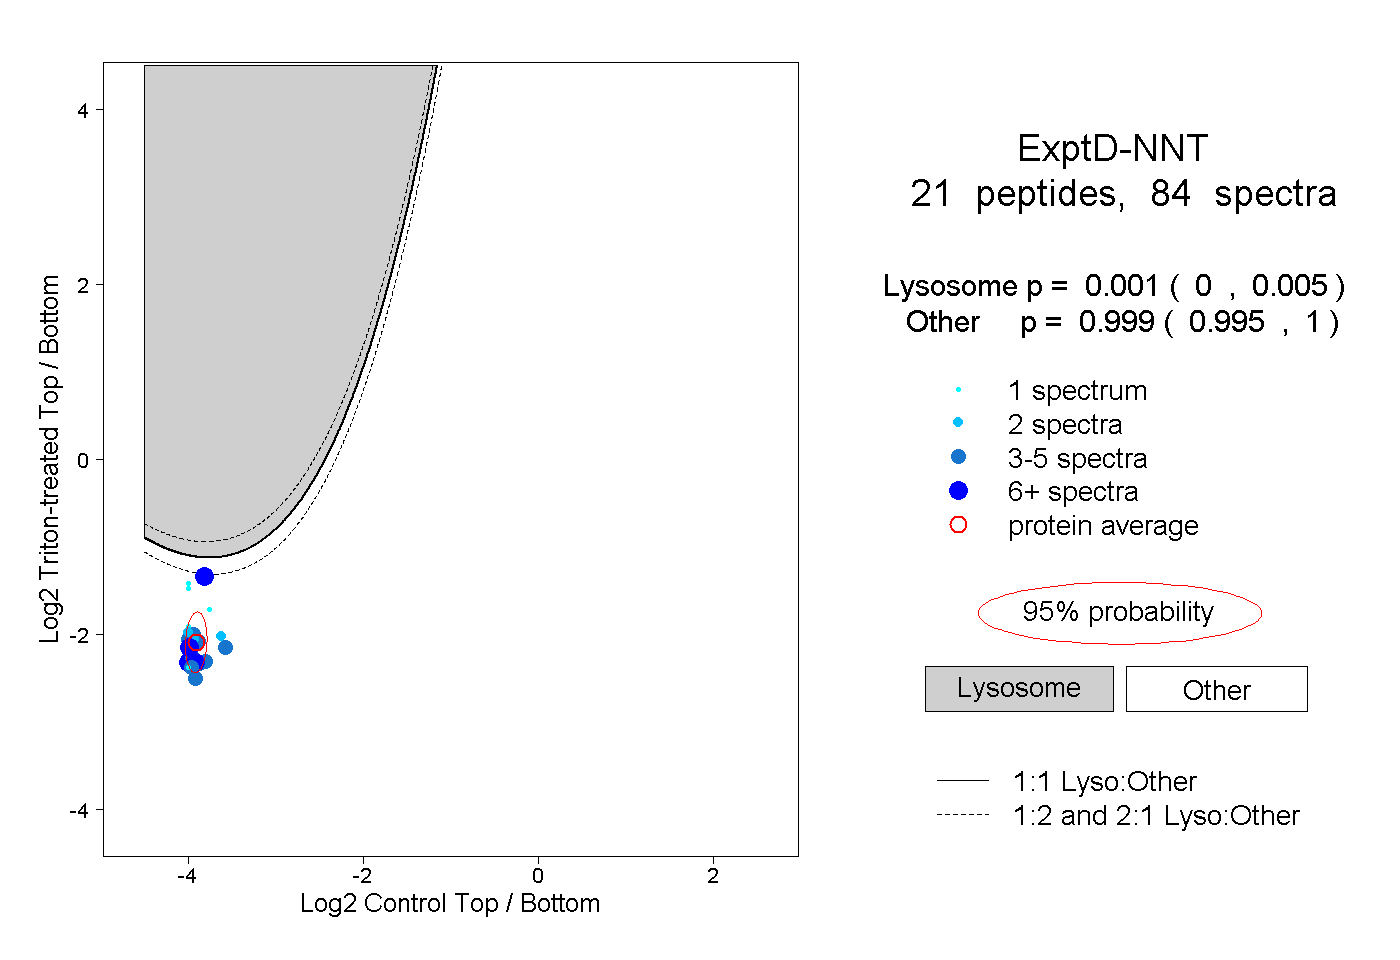 |
0.001 0.000 | 0.005 |
0.999 0.995 | 1.000 |