 2
2peptides
spectra
0.820 | 0.828
0.000 | 0.000
0.000 | 0.000
0.000 | 0.000
0.000 | 0.000
0.172 | 0.179
0.000 | 0.000
0.000 | 0.000
| Plot | Mito | Lyso | Perox | ER | Golgi | PM | Cytosol | Nucleus | |||||
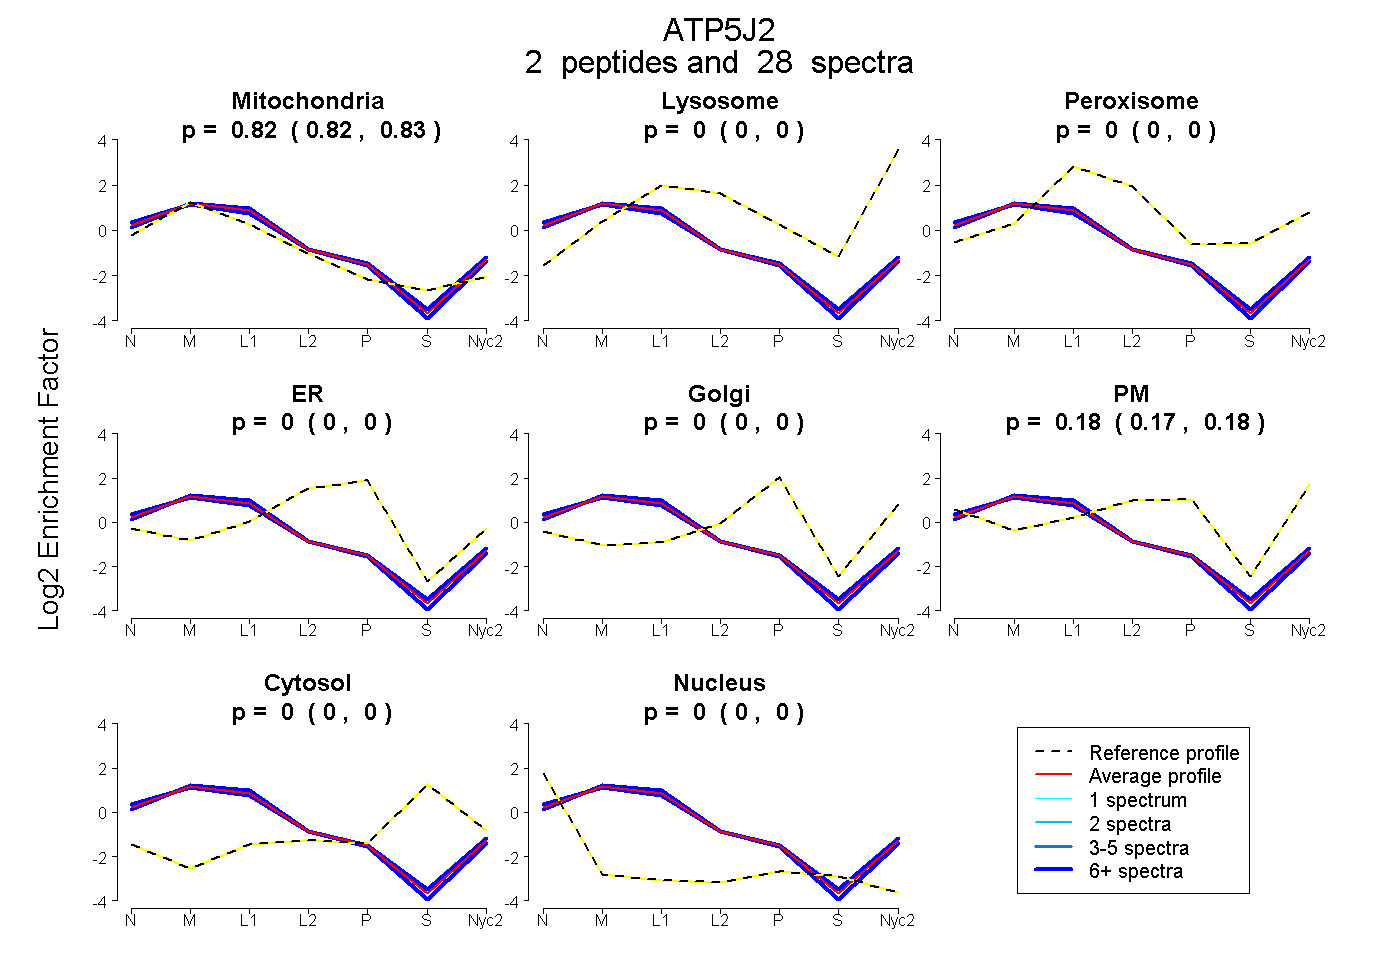
| Expt A |
2 peptides |
28 spectra |
|
0.824 0.820 | 0.828 |
0.000 0.000 | 0.000 |
0.000 0.000 | 0.000 |
0.000 0.000 | 0.000 |
0.000 0.000 | 0.000 |
0.176 0.172 | 0.179 |
0.000 0.000 | 0.000 |
0.000 0.000 | 0.000 |
| 13 spectra, DFTPSGIAGAFR | 0.837 | 0.000 | 0.000 | 0.000 | 0.000 | 0.163 | 0.000 | 0.000 | ||
| 15 spectra, ELPSWILMR | 0.813 | 0.000 | 0.000 | 0.000 | 0.000 | 0.187 | 0.000 | 0.000 |
| Plot | Mito | Lyso or Perox | ER | Golgi | PM | Cytosol | Nucleus | ||||||
| Expt B |
2 peptides |
16 spectra |
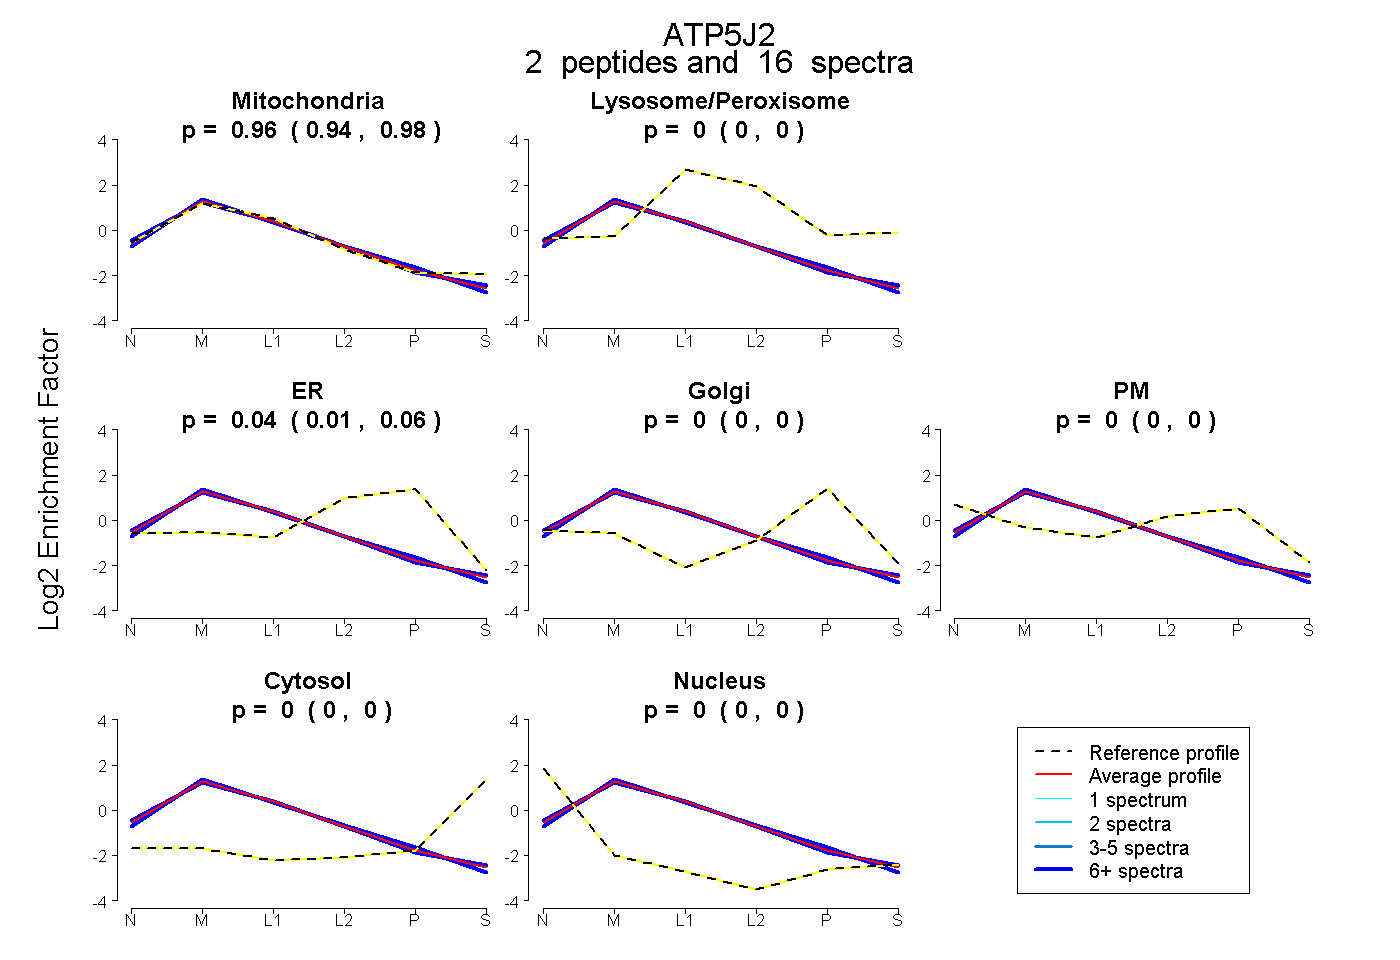 |
0.963 0.940 | 0.980 |
0.000 0.000 | 0.000 |
0.037 0.013 | 0.057 |
0.000 0.000 | 0.000 |
0.000 0.000 | 0.000 |
0.000 0.000 | 0.000 |
0.000 0.000 | 0.005 |
|||
| Plot | Lyso | Other | |||||||||||
| Expt C |
4 peptides |
98 spectra |
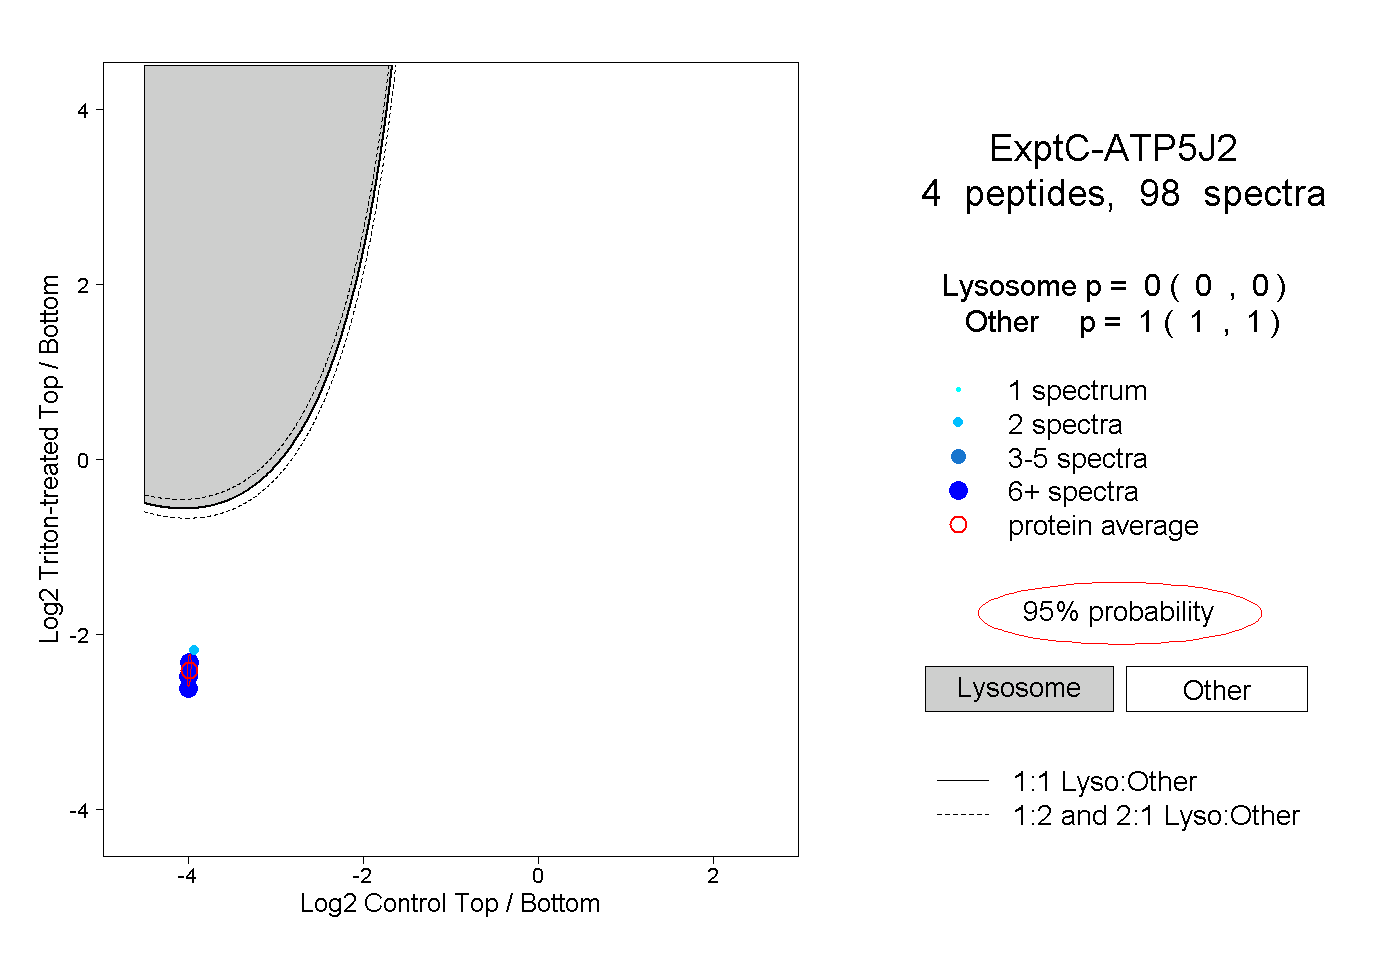 |
0.000 0.000 | 0.000 |
1.000 1.000 | 1.000 |