 6
6peptides
spectra
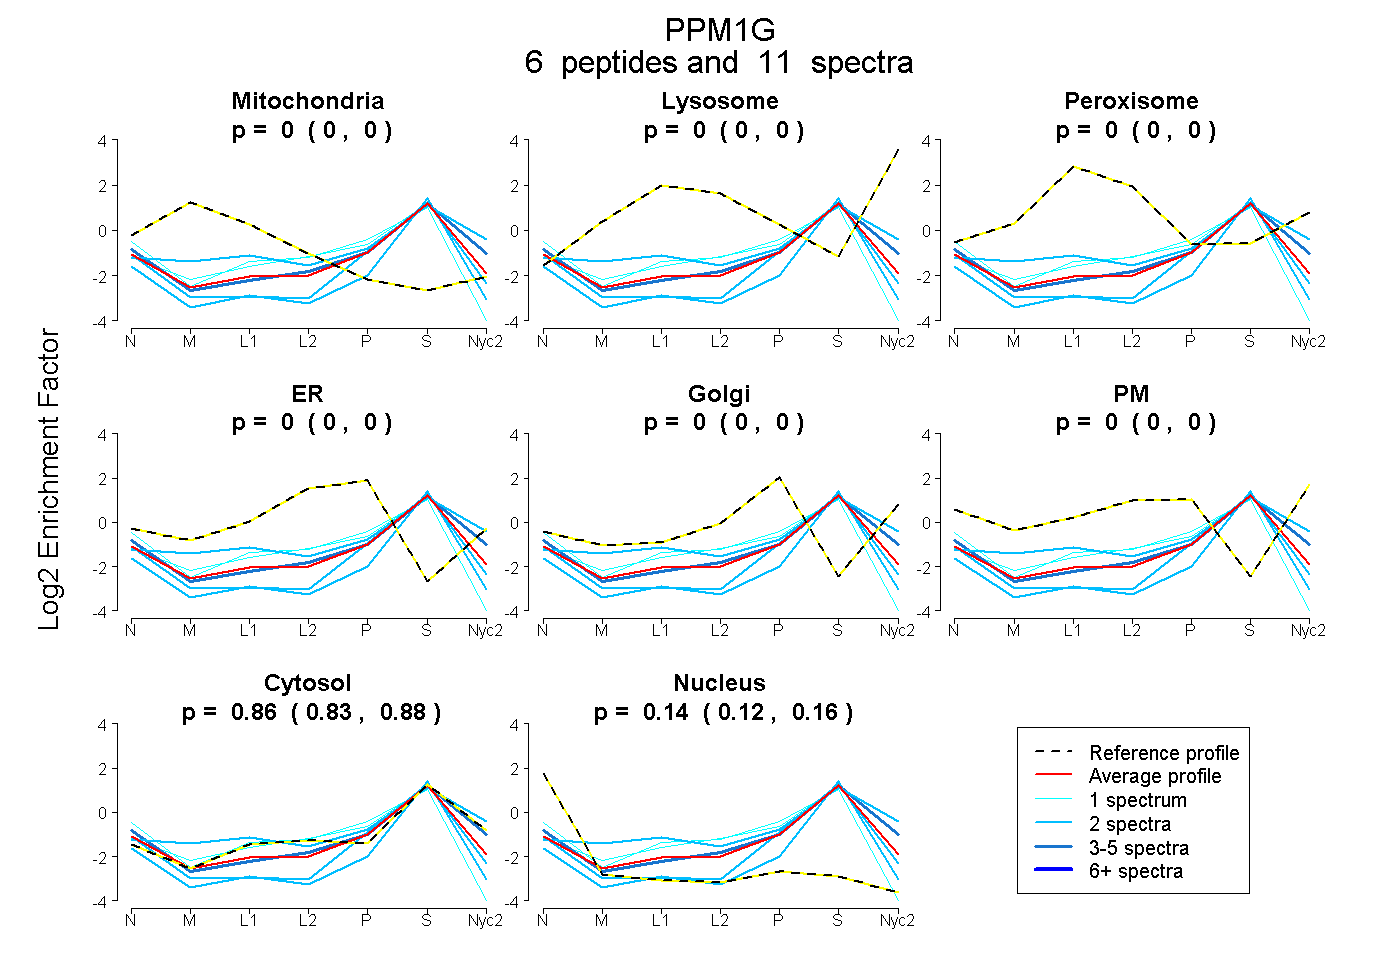
0.000 | 0.000
0.000 | 0.000
0.000 | 0.000
0.000 | 0.000
0.000 | 0.000
0.000 | 0.000
0.833 | 0.878
0.117 | 0.164
| Plot | Mito | Lyso | Perox | ER | Golgi | PM | Cytosol | Nucleus | |||||
| Expt A |
6 peptides |
11 spectra |
|
0.000 0.000 | 0.000 |
0.000 0.000 | 0.000 |
0.000 0.000 | 0.000 |
0.000 0.000 | 0.000 |
0.000 0.000 | 0.000 |
0.000 0.000 | 0.000 |
0.857 0.833 | 0.878 |
0.143 0.117 | 0.164 |
| 2 spectra, QLIVANAGDSR | 0.000 | 0.000 | 0.000 | 0.000 | 0.000 | 0.000 | 0.721 | 0.279 | ||
| 3 spectra, VTMDGR | 0.000 | 0.000 | 0.000 | 0.000 | 0.000 | 0.000 | 0.896 | 0.104 | ||
| 2 spectra, YLPDIIK | 0.000 | 0.000 | 0.000 | 0.000 | 0.000 | 0.000 | 0.754 | 0.246 | ||
| 1 spectrum, ALQDAFLAIDAK | 0.000 | 0.000 | 0.000 | 0.026 | 0.077 | 0.000 | 0.897 | 0.000 | ||
| 2 spectra, YGQNCQK | 0.065 | 0.068 | 0.000 | 0.000 | 0.053 | 0.000 | 0.814 | 0.000 | ||
| 1 spectrum, EEPGSDSGTTAVVALIR | 0.000 | 0.000 | 0.000 | 0.057 | 0.000 | 0.000 | 0.688 | 0.255 |
| Plot | Mito | Lyso or Perox | ER | Golgi | PM | Cytosol | Nucleus | ||||||
| Expt B |
1 peptide |
1 spectrum |
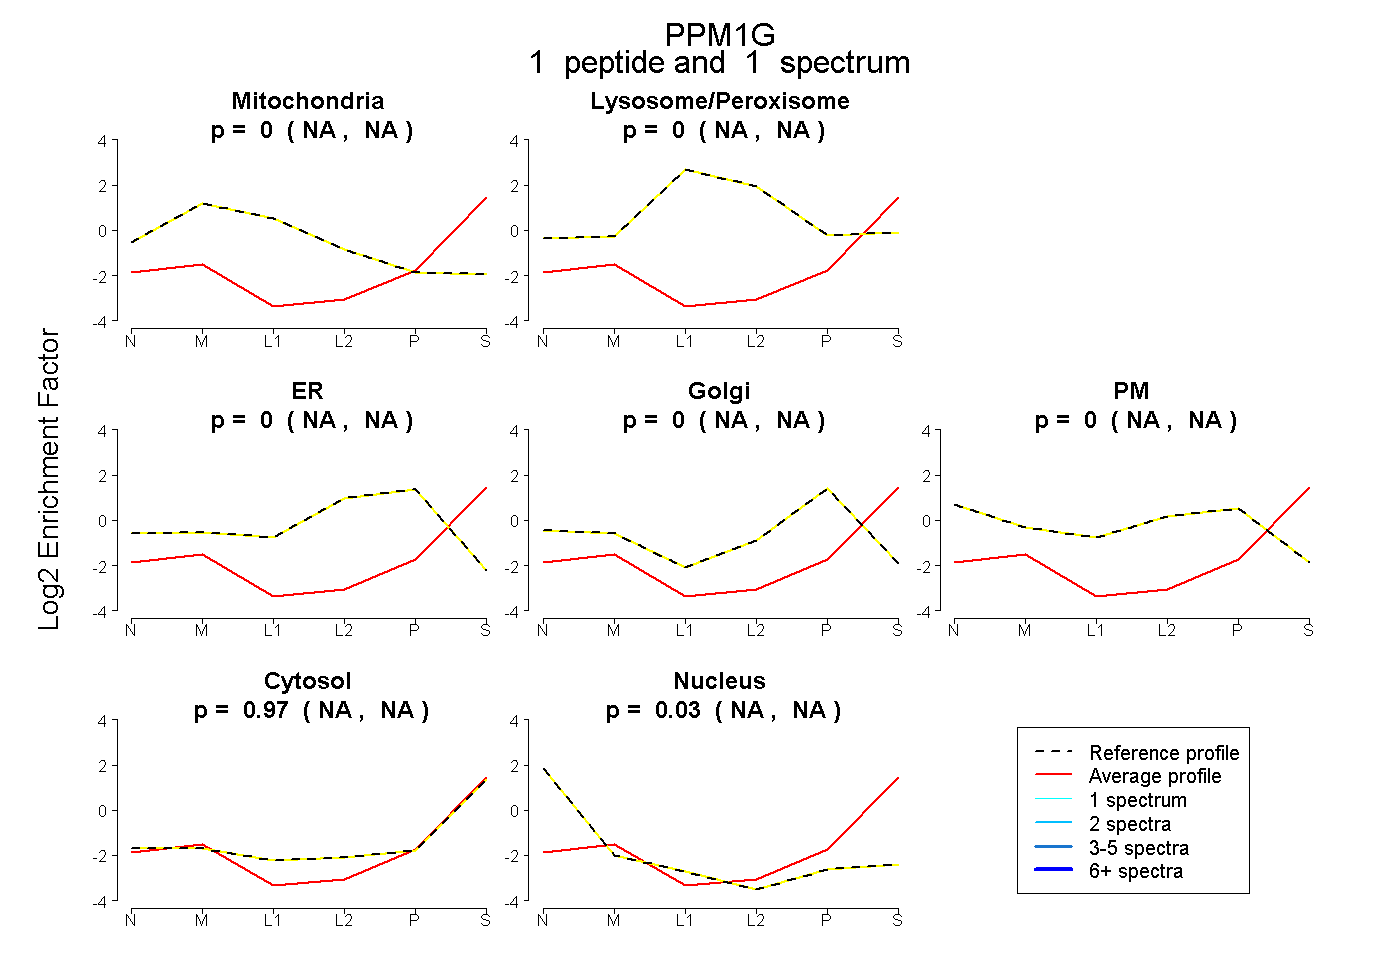 |
0.000 NA | NA |
0.000 NA | NA |
0.000 NA | NA |
0.000 NA | NA |
0.000 NA | NA |
0.969 NA | NA |
0.031 NA | NA |