 12
12peptides
spectra
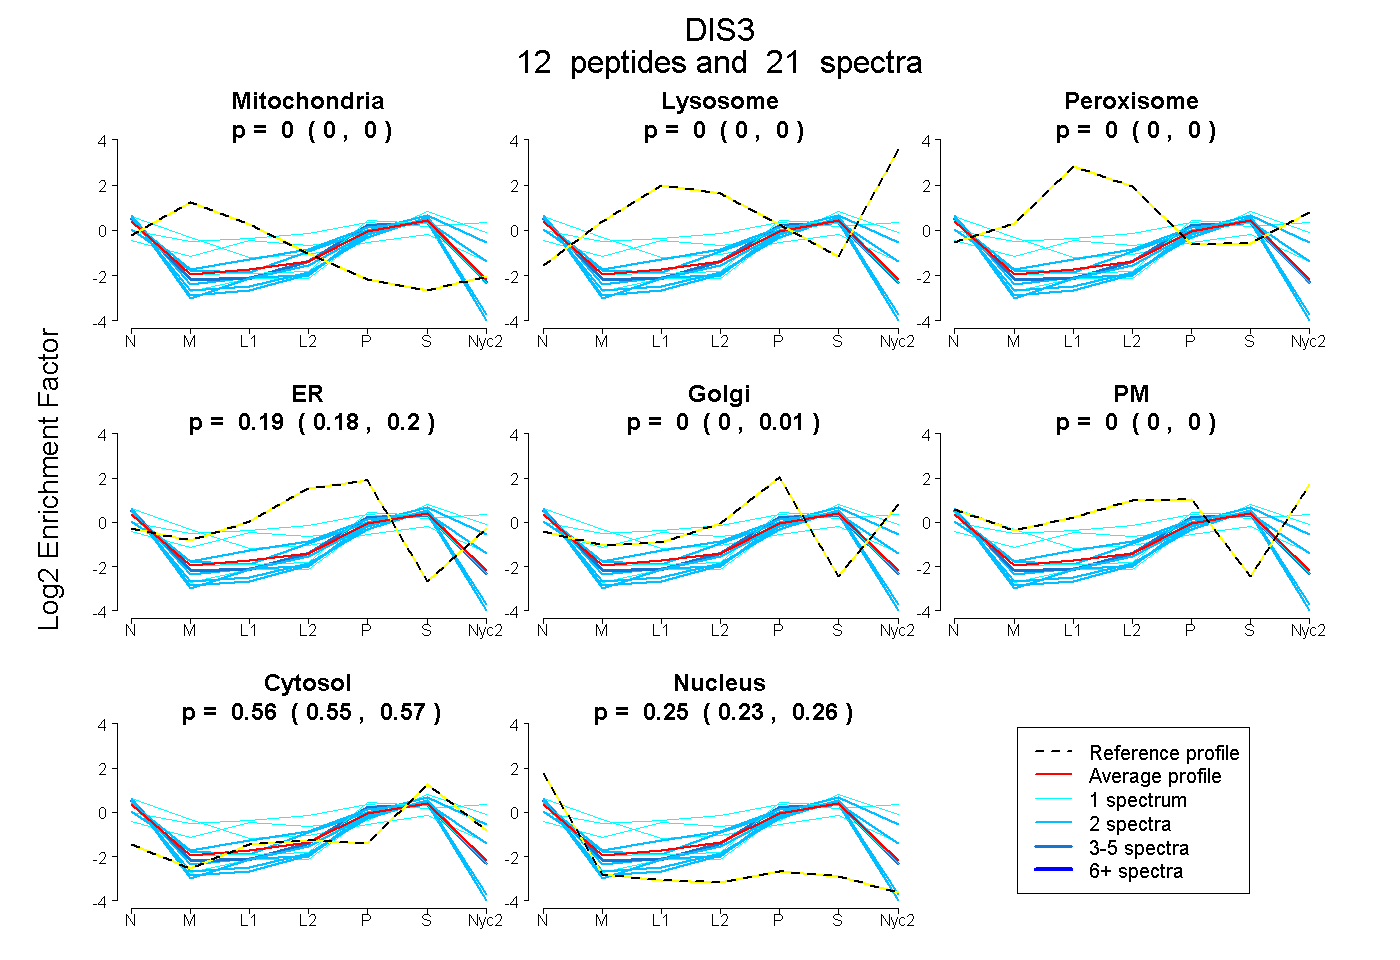
0.000 | 0.000
0.000 | 0.000
0.000 | 0.000
0.175 | 0.199
0.000 | 0.009
0.000 | 0.000
0.550 | 0.570
0.234 | 0.260
| Plot | Mito | Lyso | Perox | ER | Golgi | PM | Cytosol | Nucleus | |||||
| Expt A |
12 peptides |
21 spectra |
|
0.000 0.000 | 0.000 |
0.000 0.000 | 0.000 |
0.000 0.000 | 0.000 |
0.191 0.175 | 0.199 |
0.000 0.000 | 0.009 |
0.000 0.000 | 0.000 |
0.561 0.550 | 0.570 |
0.249 0.234 | 0.260 |
| 2 spectra, SLTANPELIDR | 0.000 | 0.000 | 0.000 | 0.006 | 0.000 | 0.000 | 0.529 | 0.465 | ||
| 1 spectrum, AECPDFPYLNTLLR | 0.000 | 0.000 | 0.000 | 0.019 | 0.000 | 0.000 | 0.536 | 0.445 | ||
| 2 spectra, MPWSITEEDMK | 0.000 | 0.000 | 0.000 | 0.000 | 0.242 | 0.052 | 0.638 | 0.067 | ||
| 2 spectra, LTYDDEIPSLR | 0.000 | 0.000 | 0.000 | 0.000 | 0.072 | 0.000 | 0.593 | 0.335 | ||
| 1 spectrum, IDSAAMNDDITTSLR | 0.254 | 0.000 | 0.000 | 0.006 | 0.024 | 0.195 | 0.397 | 0.125 | ||
| 4 spectra, MLRPTGR | 0.000 | 0.000 | 0.000 | 0.172 | 0.025 | 0.000 | 0.519 | 0.284 | ||
| 1 spectrum, SGSYLQGTFR | 0.000 | 0.000 | 0.000 | 0.052 | 0.172 | 0.000 | 0.497 | 0.279 | ||
| 1 spectrum, GIVSEEAYILFVR | 0.000 | 0.000 | 0.141 | 0.000 | 0.068 | 0.365 | 0.426 | 0.000 | ||
| 1 spectrum, HLCVCSVDPPGCTDIDDALHCR | 0.000 | 0.000 | 0.152 | 0.000 | 0.000 | 0.205 | 0.643 | 0.000 | ||
| 2 spectra, YGLEGTVFFEEK | 0.000 | 0.000 | 0.000 | 0.285 | 0.010 | 0.000 | 0.566 | 0.138 | ||
| 2 spectra, GALTLSSPEIR | 0.000 | 0.000 | 0.000 | 0.081 | 0.000 | 0.000 | 0.469 | 0.450 | ||
| 2 spectra, SLADSLDR | 0.000 | 0.000 | 0.000 | 0.074 | 0.000 | 0.000 | 0.515 | 0.411 |
| Plot | Lyso | Other | |||||||||||
| Expt C |
3 peptides |
5 spectra |
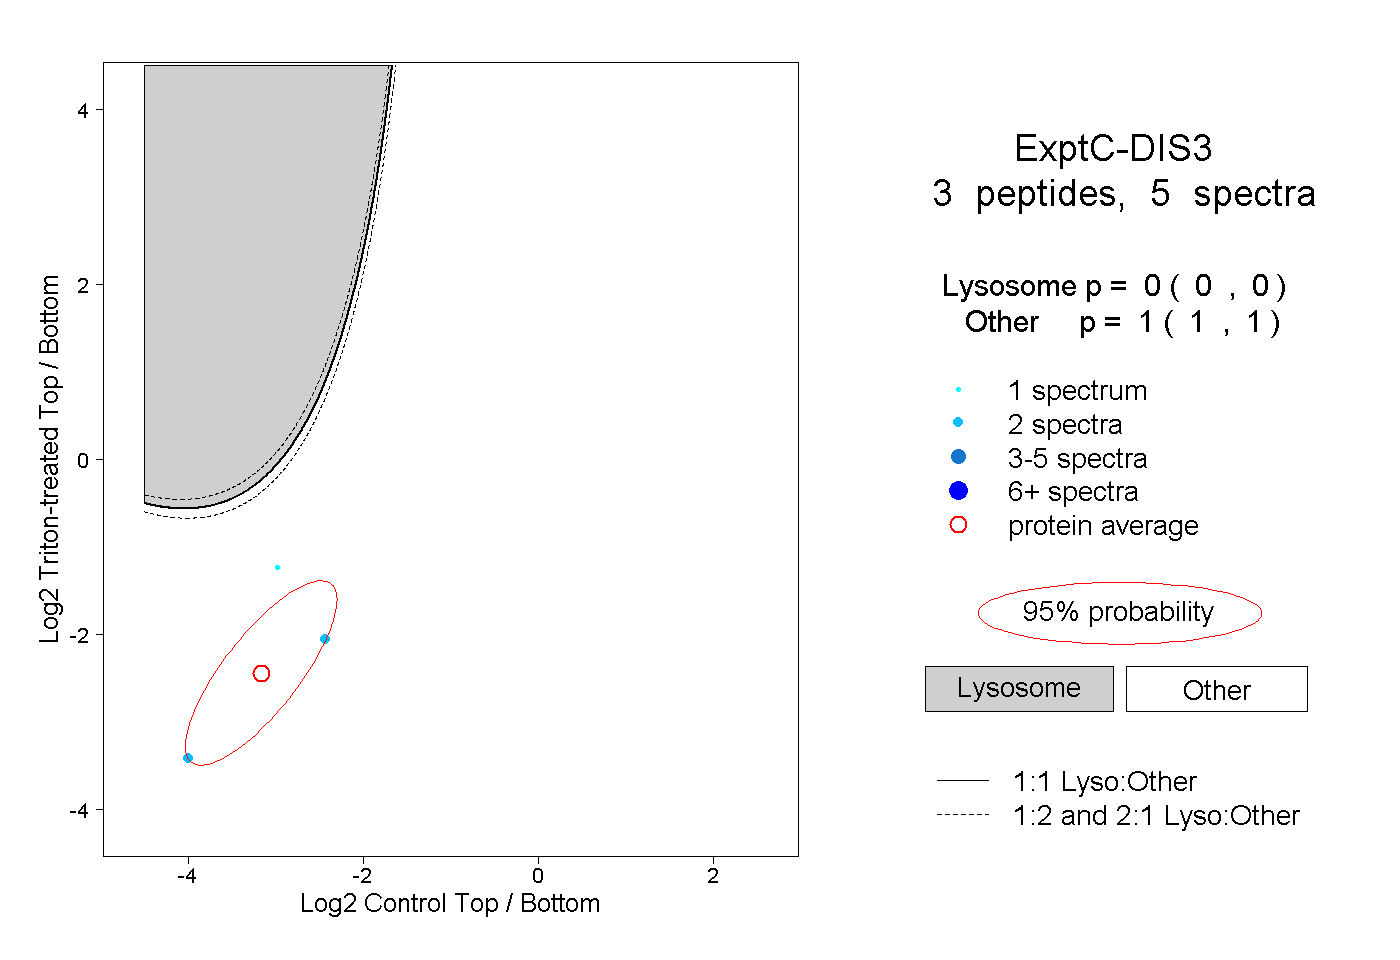 |
0.000 0.000 | 0.000 |
1.000 1.000 | 1.000 |