 74
74peptides
spectra
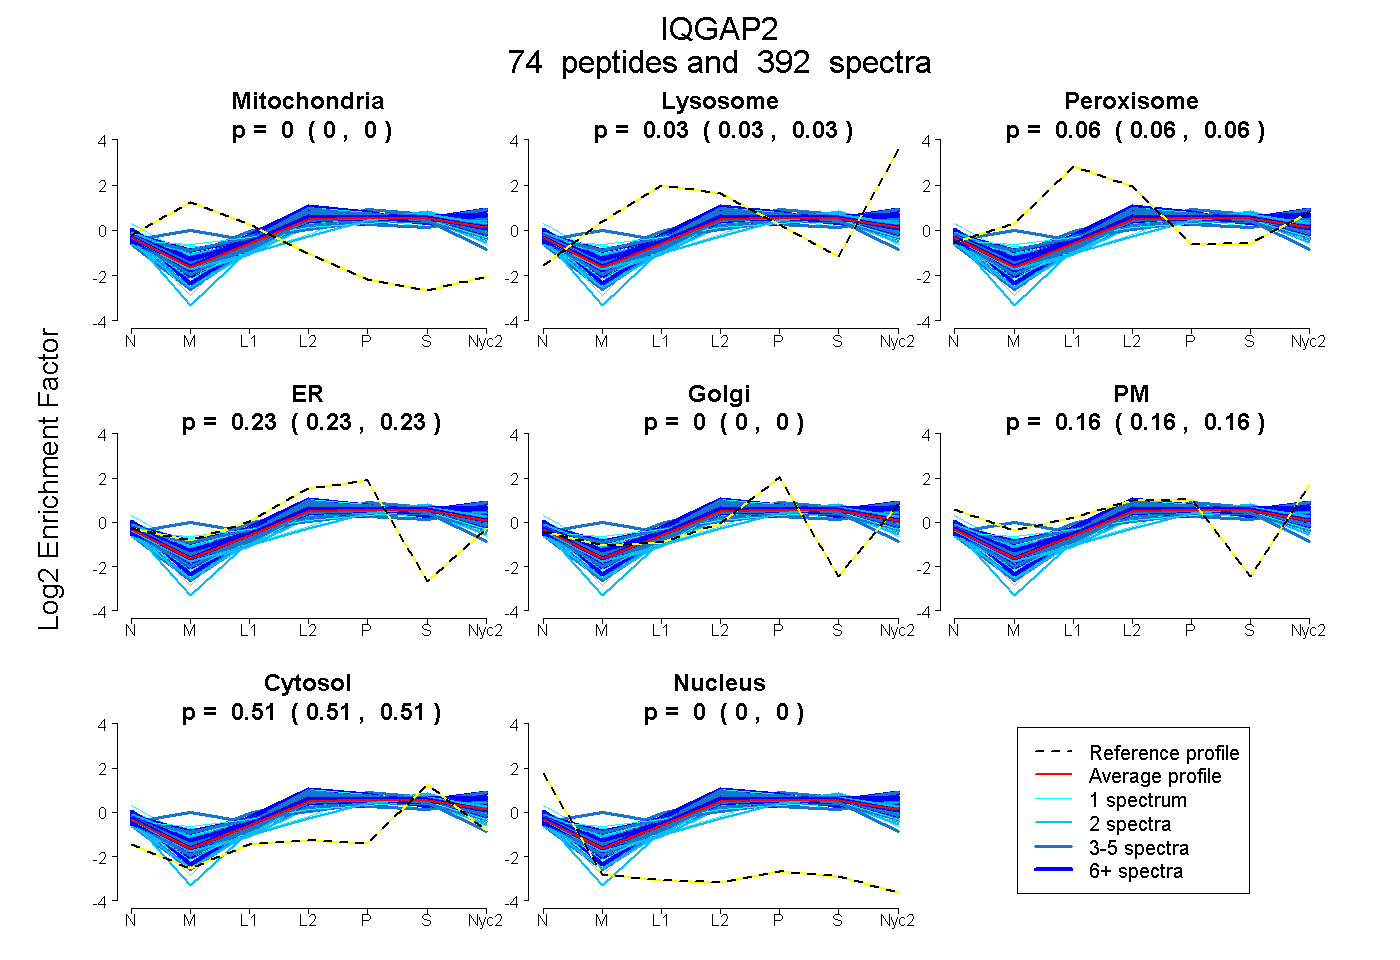
0.000 | 0.000
0.032 | 0.034
0.063 | 0.065
0.231 | 0.233
0.000 | 0.000
0.158 | 0.161
0.512 | 0.512
0.000 | 0.000
45peptides
spectra
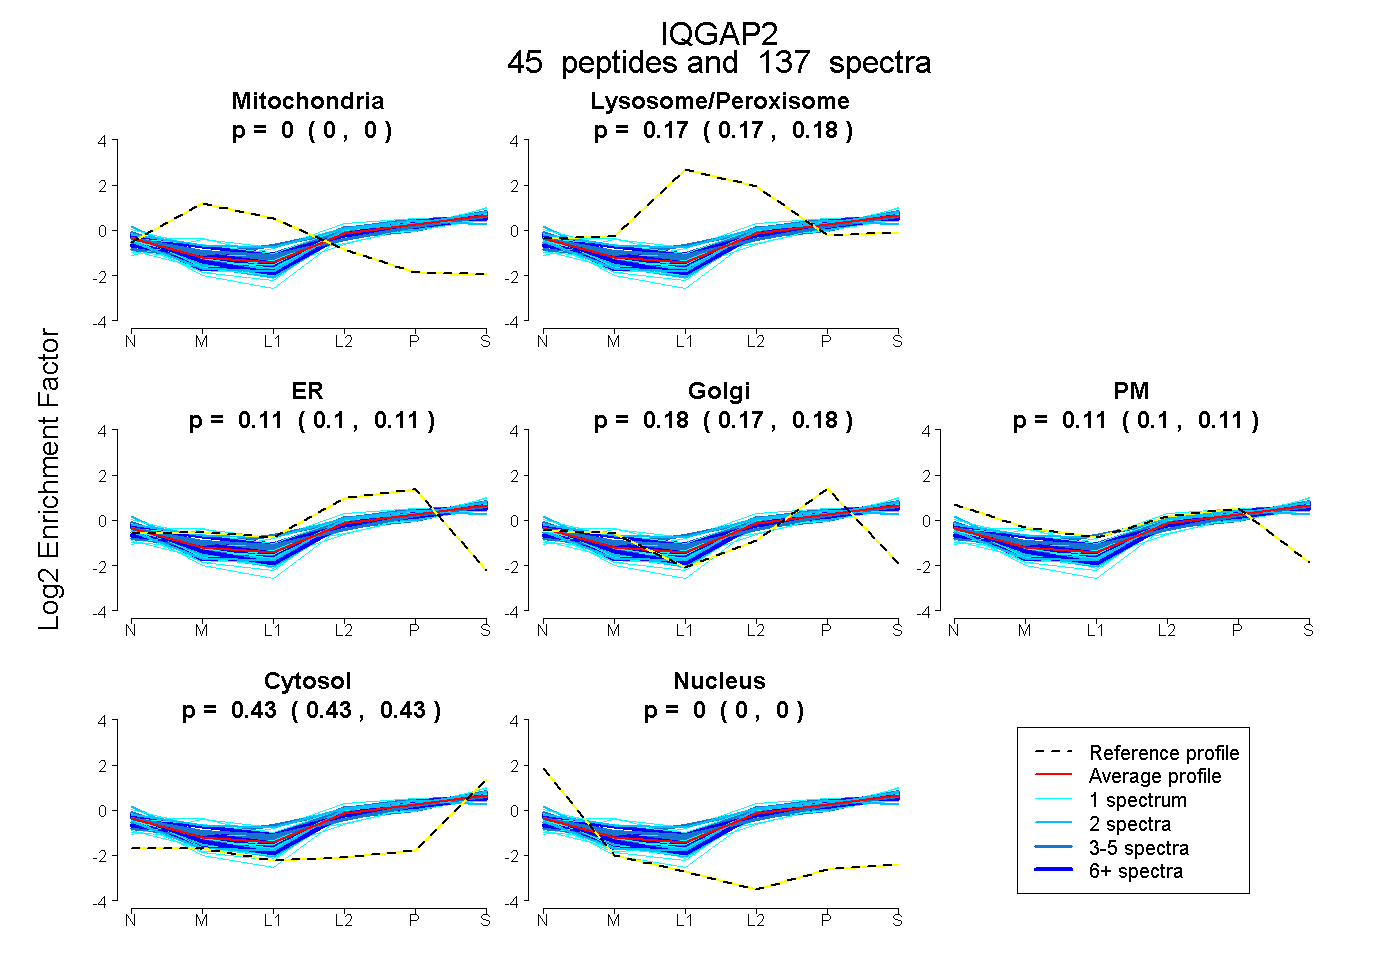
0.000 | 0.000
0.171 | 0.178
0.102 | 0.114
0.169 | 0.181
0.105 | 0.113
0.430 | 0.433
0.000 | 0.000
73peptides
spectra
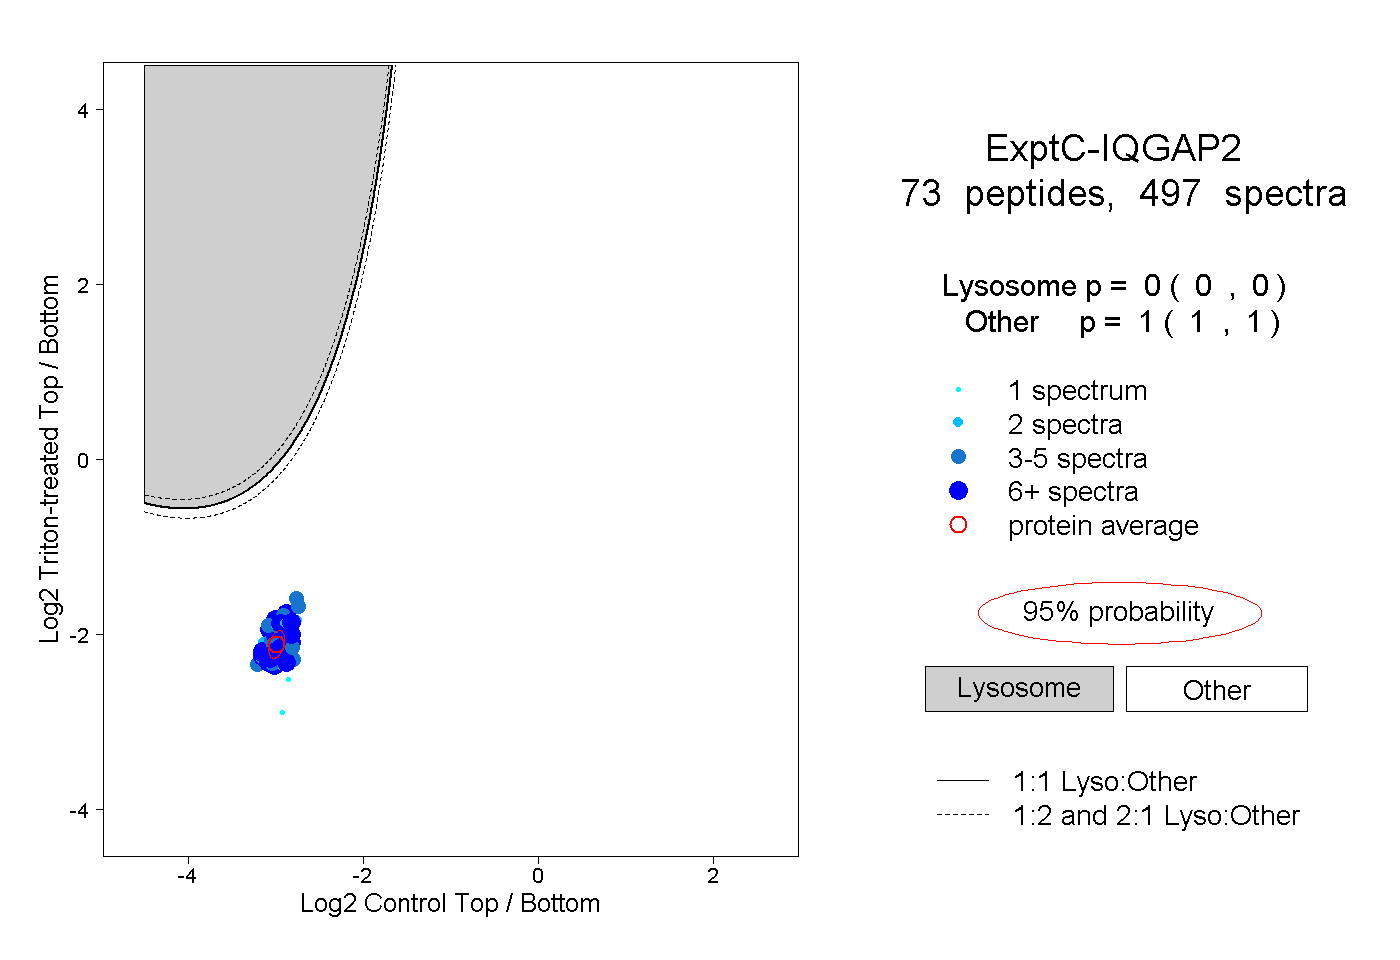
0.000 | 0.000
1.000 | 1.000
31peptides
spectra
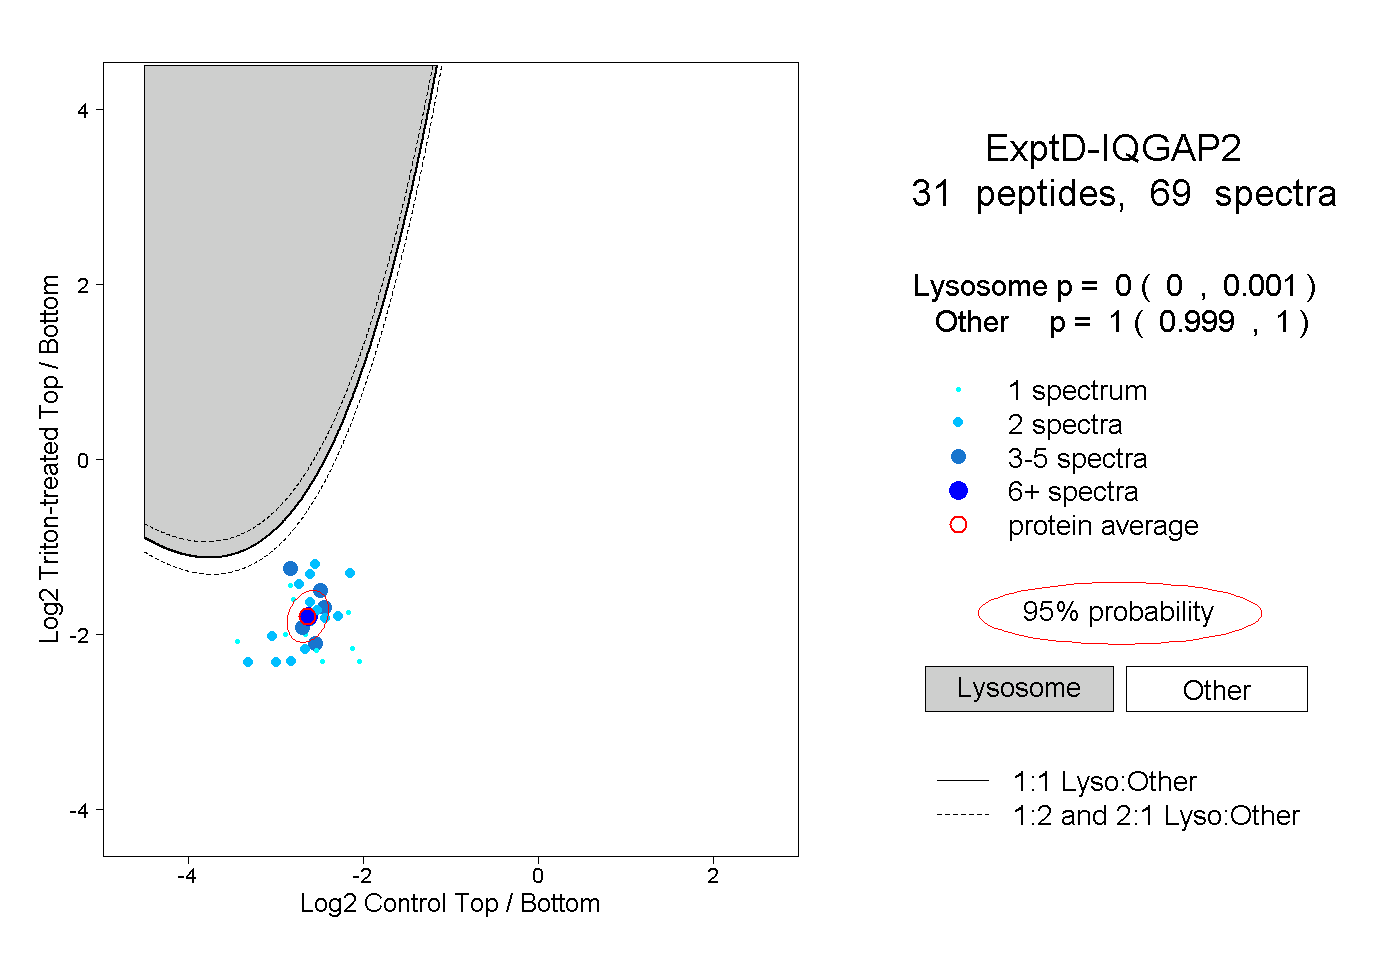
0.000 | 0.001
0.999 | 1.000