4
4peptides
spectra
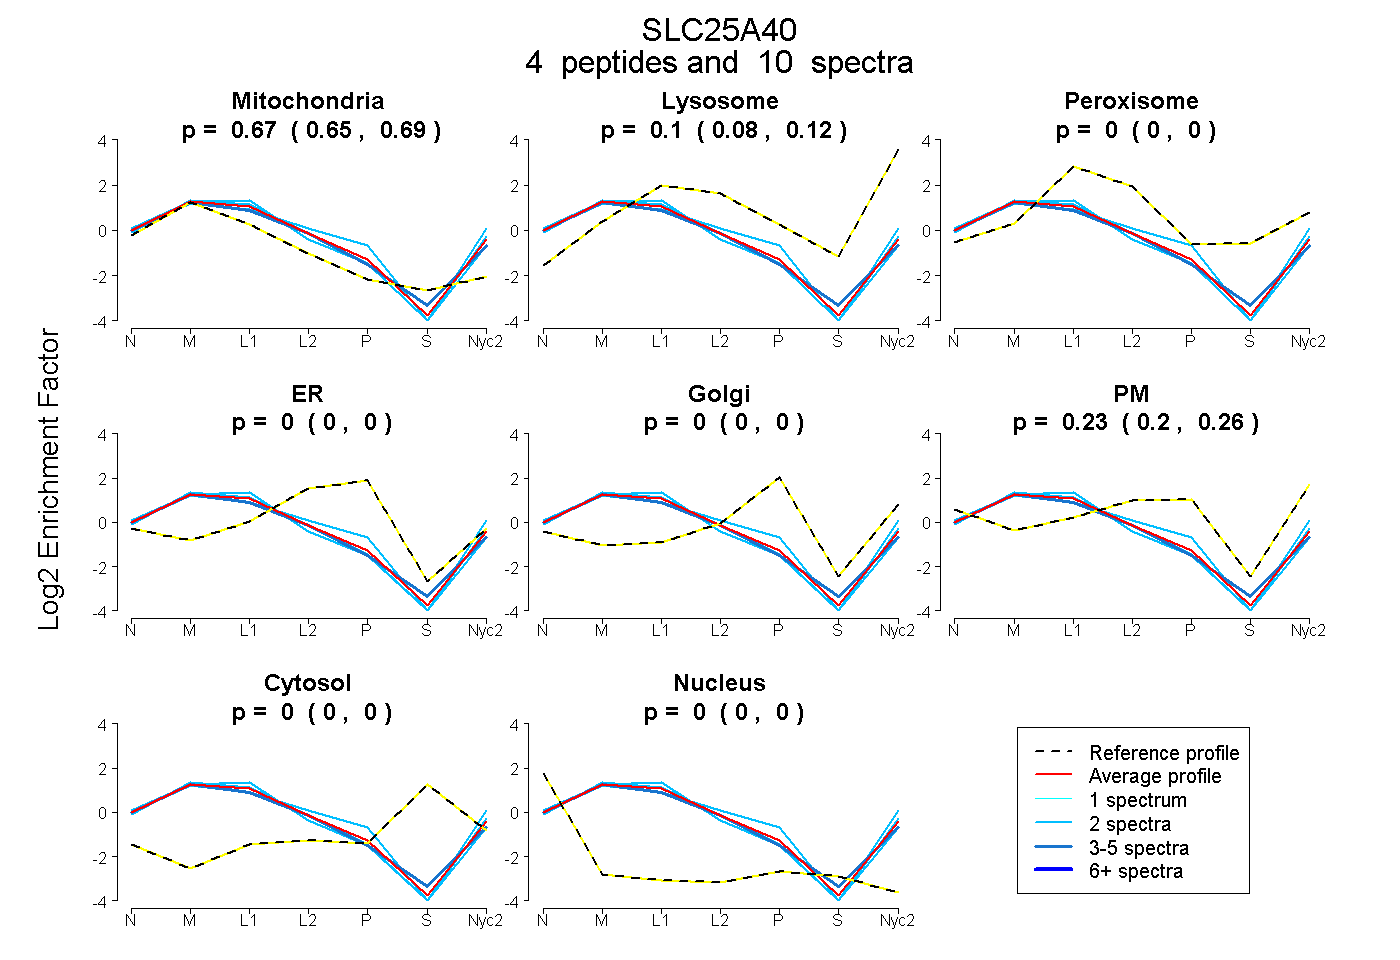
0.652 | 0.688
0.076 | 0.116
0.000 | 0.000
0.000 | 0.000
0.000 | 0.000
0.202 | 0.255
0.000 | 0.000
0.000 | 0.000
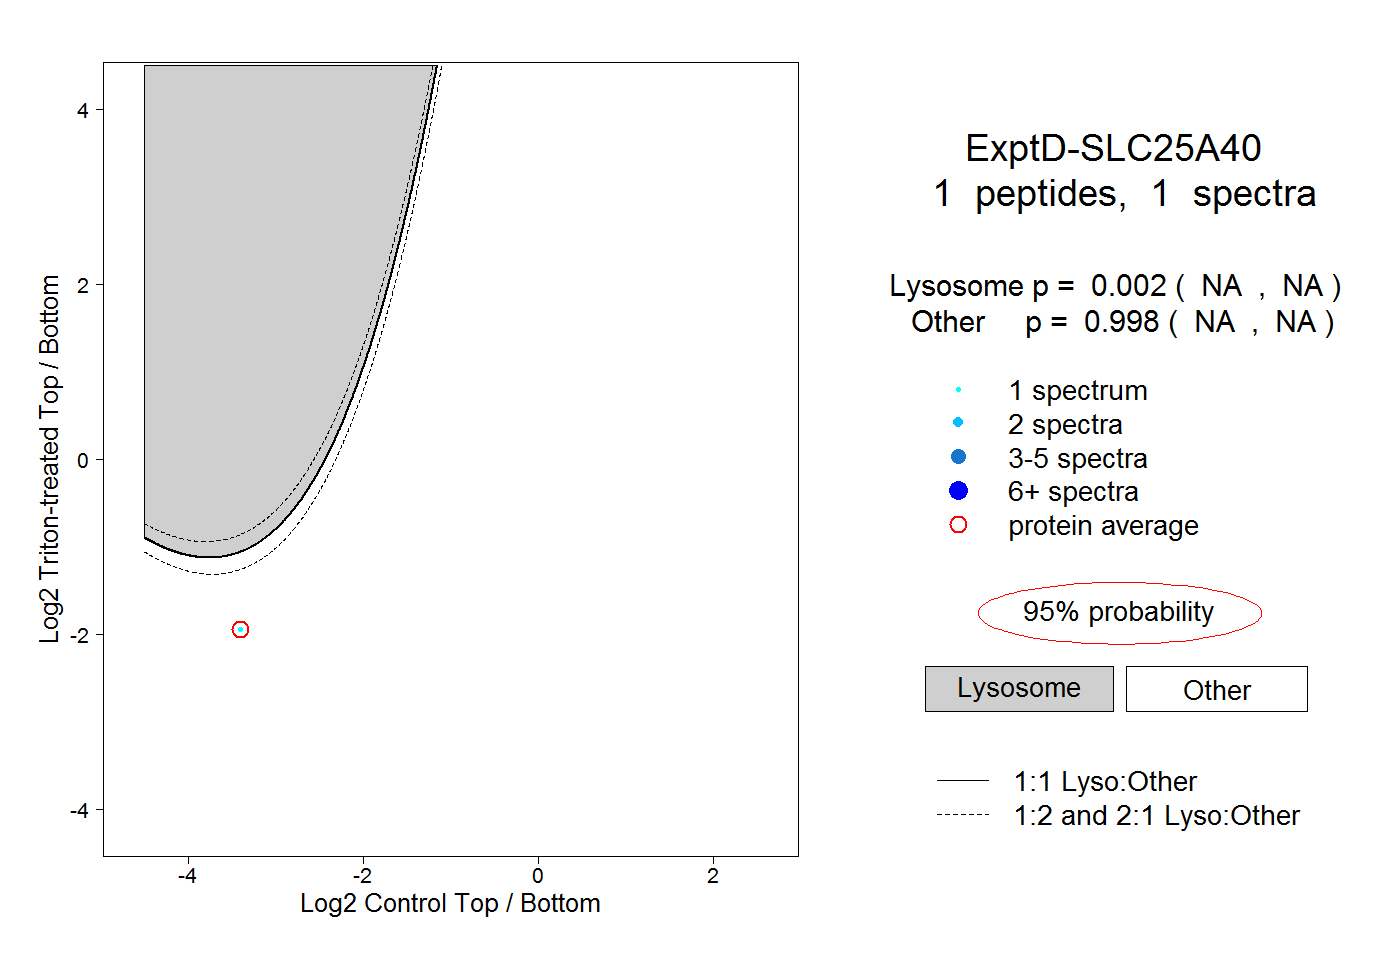
1peptide
spectrum
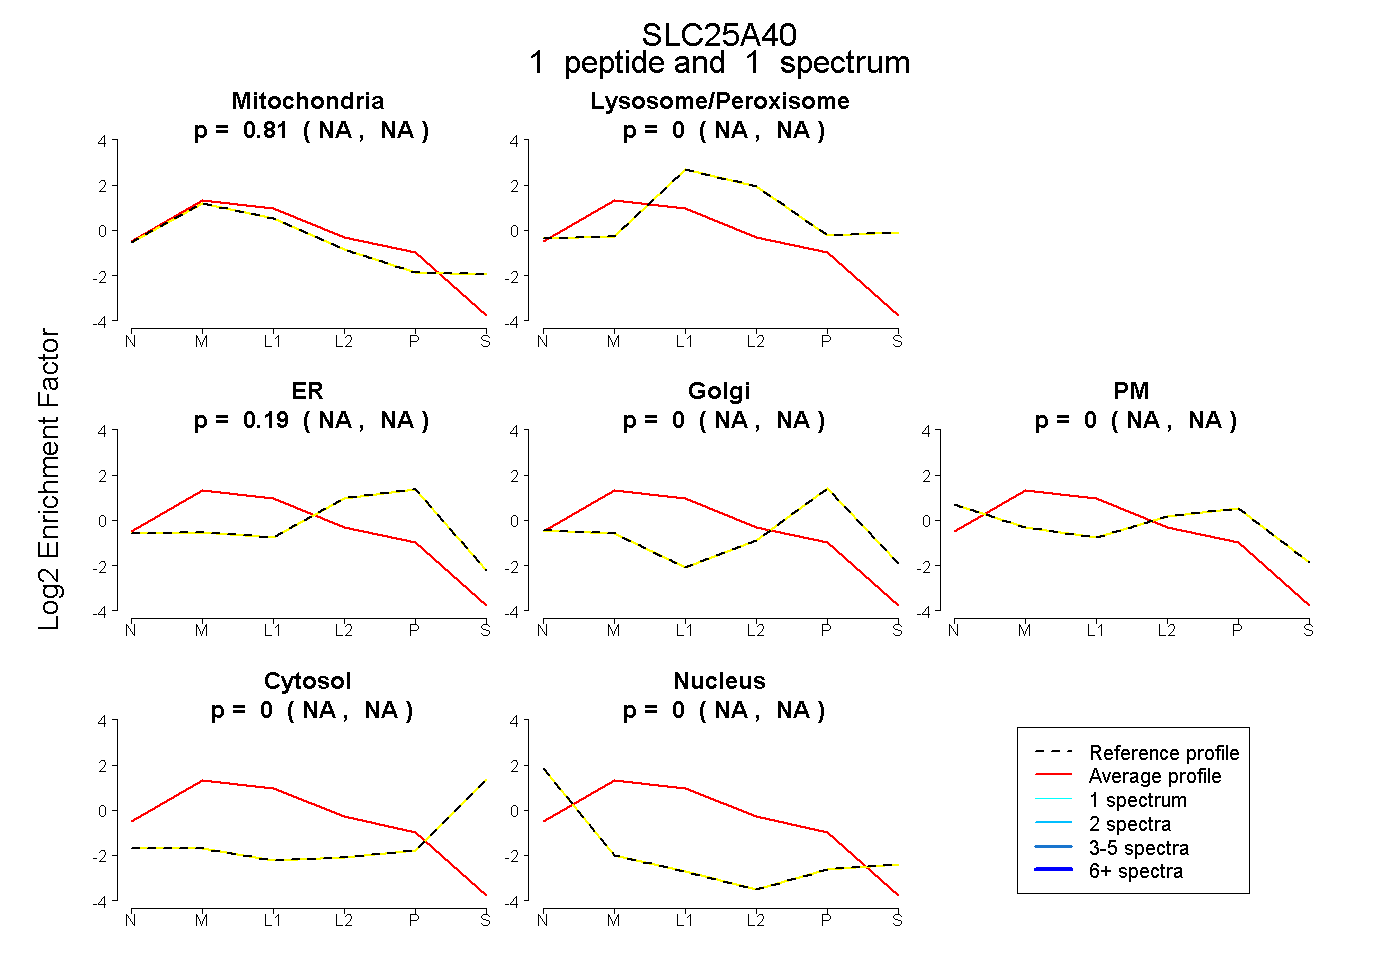
NA | NA
NA | NA
NA | NA
NA | NA
NA | NA
NA | NA
NA | NA
7peptides
spectra
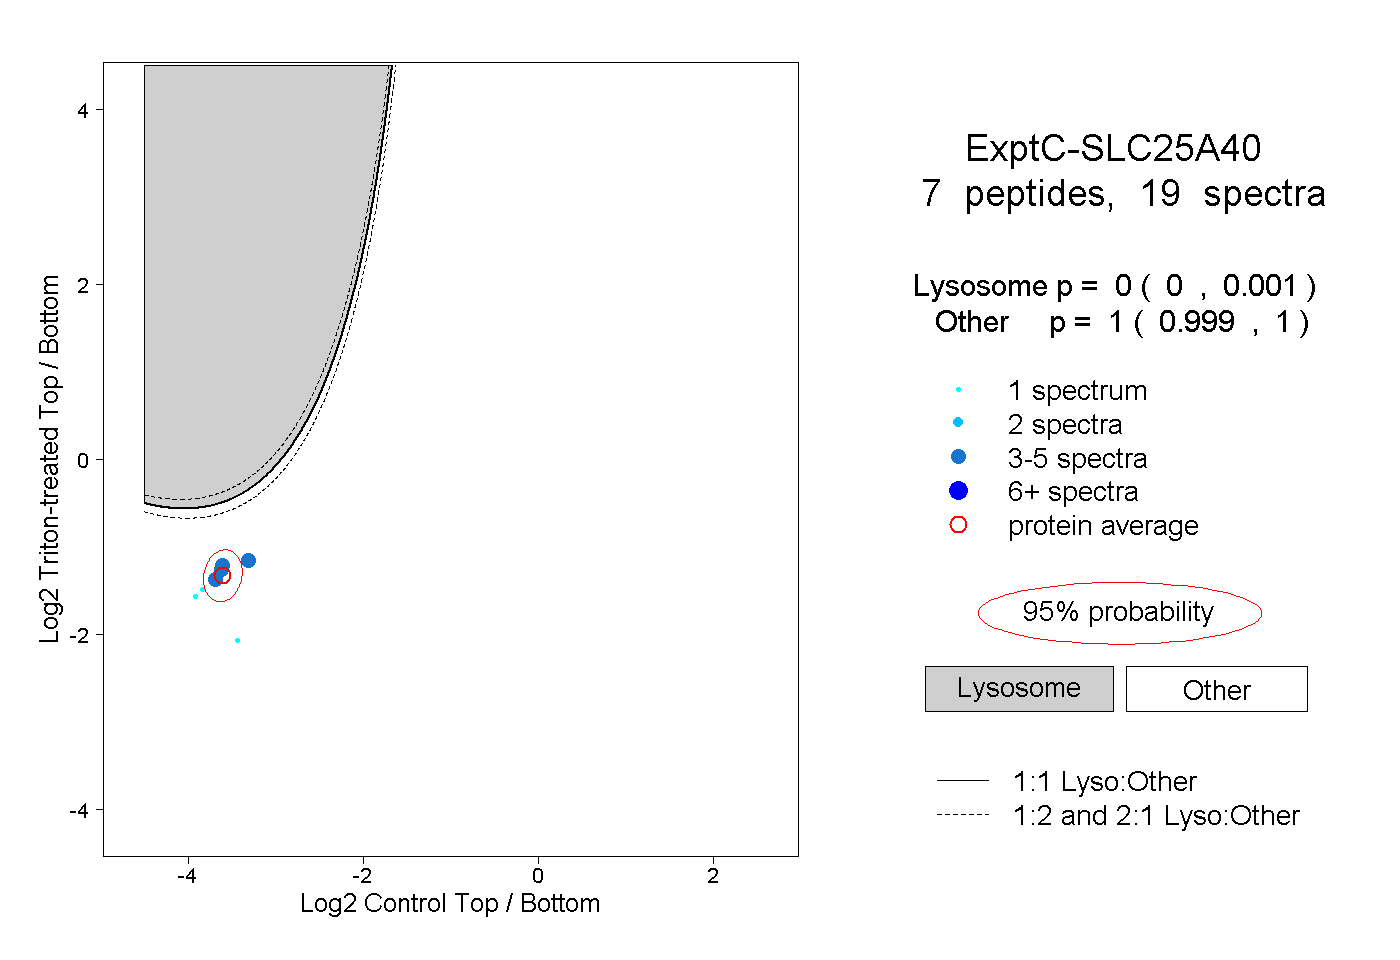
0.000 | 0.001
0.999 | 1.000