 4
4peptides
spectra
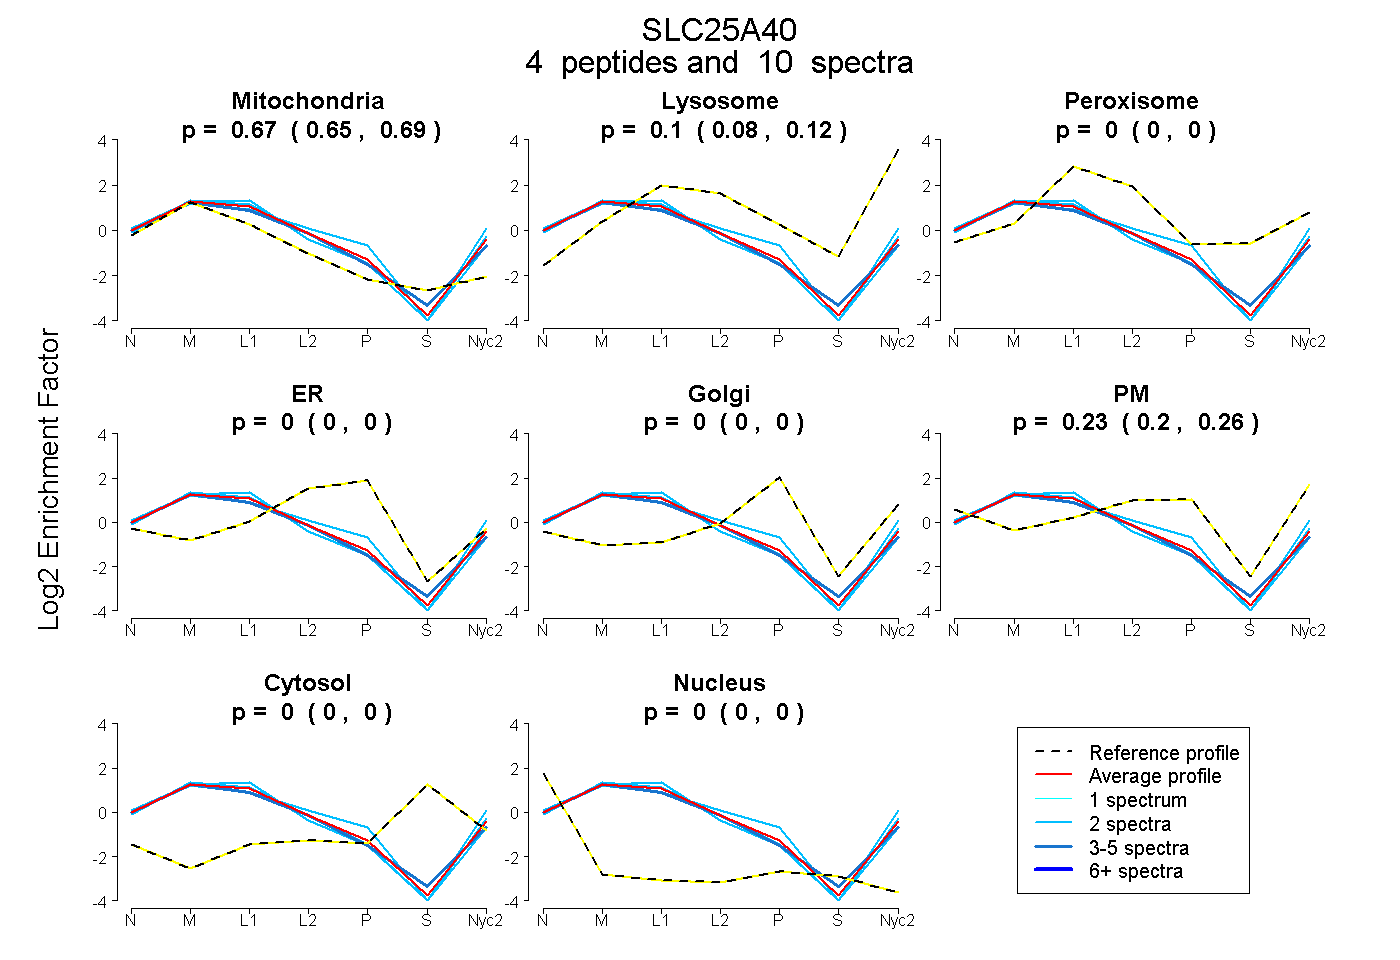
0.652 | 0.688
0.076 | 0.116
0.000 | 0.000
0.000 | 0.000
0.000 | 0.000
0.202 | 0.255
0.000 | 0.000
0.000 | 0.000
| Plot | Mito | Lyso | Perox | ER | Golgi | PM | Cytosol | Nucleus | |||||
| Expt A |
4 peptides |
10 spectra |
|
0.672 0.652 | 0.688 |
0.097 0.076 | 0.116 |
0.000 0.000 | 0.000 |
0.000 0.000 | 0.000 |
0.000 0.000 | 0.000 |
0.231 0.202 | 0.255 |
0.000 0.000 | 0.000 |
0.000 0.000 | 0.000 |
| 2 spectra, GWAPTILR | 0.532 | 0.067 | 0.000 | 0.000 | 0.000 | 0.400 | 0.000 | 0.000 | ||
| 2 spectra, GFSGLFTGLIPR | 0.725 | 0.085 | 0.000 | 0.000 | 0.000 | 0.190 | 0.000 | 0.000 | ||
| 4 spectra, IPIVAGIVAR | 0.726 | 0.099 | 0.000 | 0.000 | 0.000 | 0.175 | 0.000 | 0.000 | ||
| 2 spectra, GFFQQQNVESR | 0.696 | 0.119 | 0.000 | 0.000 | 0.000 | 0.185 | 0.000 | 0.000 |
| Plot | Mito | Lyso or Perox | ER | Golgi | PM | Cytosol | Nucleus | ||||||
| Expt B |
1 peptide |
1 spectrum |
 |
0.806 NA | NA |
0.000 NA | NA |
0.194 NA | NA |
0.000 NA | NA |
0.000 NA | NA |
0.000 NA | NA |
0.000 NA | NA |
|||
| Plot | Lyso | Other | |||||||||||
| Expt C |
7 peptides |
19 spectra |
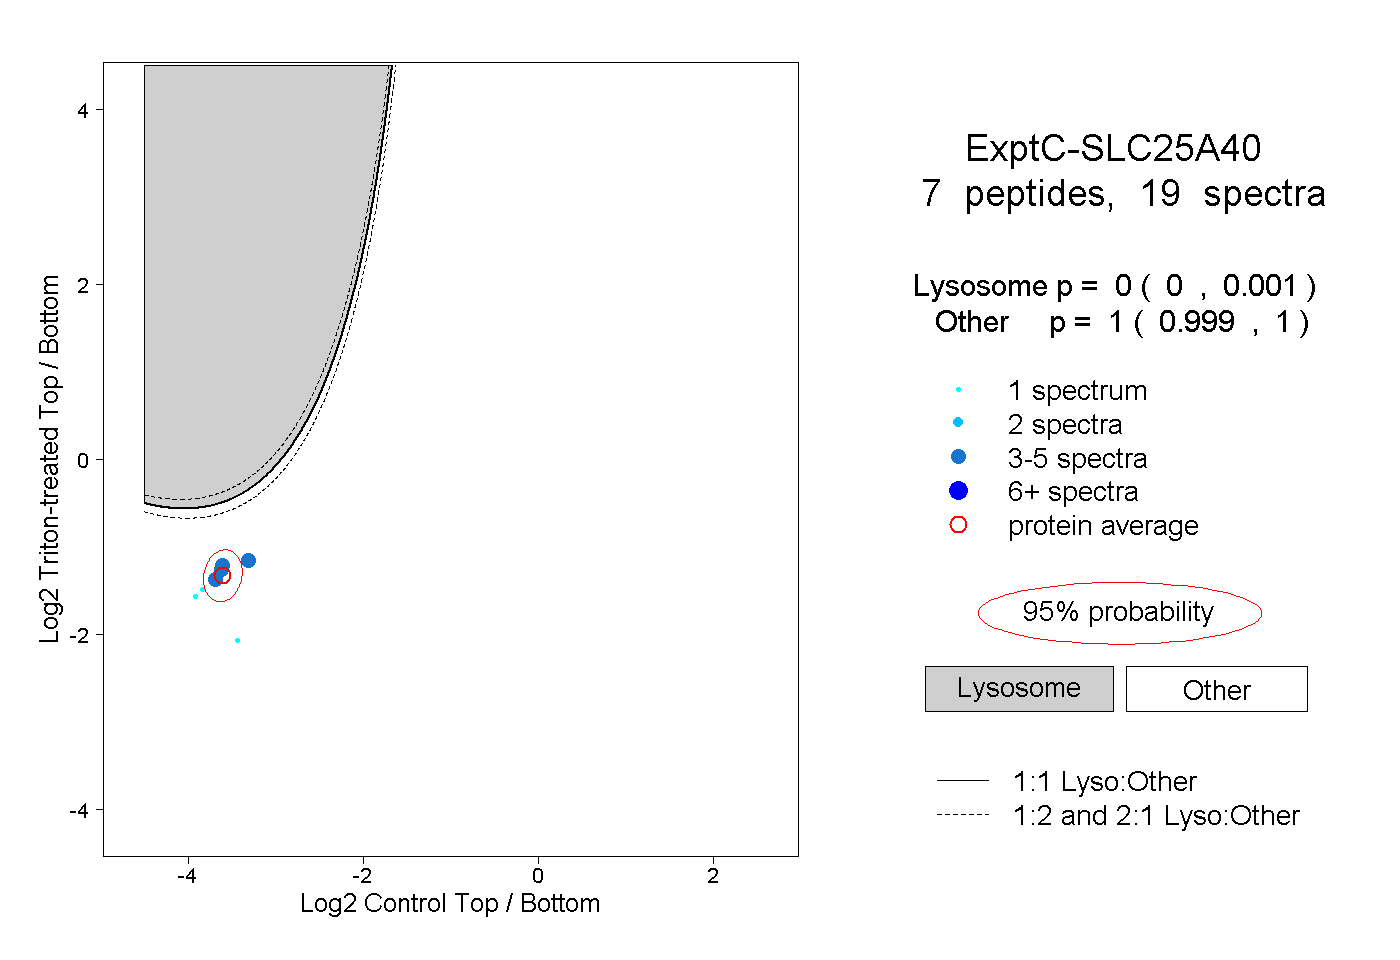 |
0.000 0.000 | 0.001 |
1.000 0.999 | 1.000 |
||||||||
| Plot | Lyso | Other | |||||||||||
| Expt D |
1 peptide |
1 spectrum |
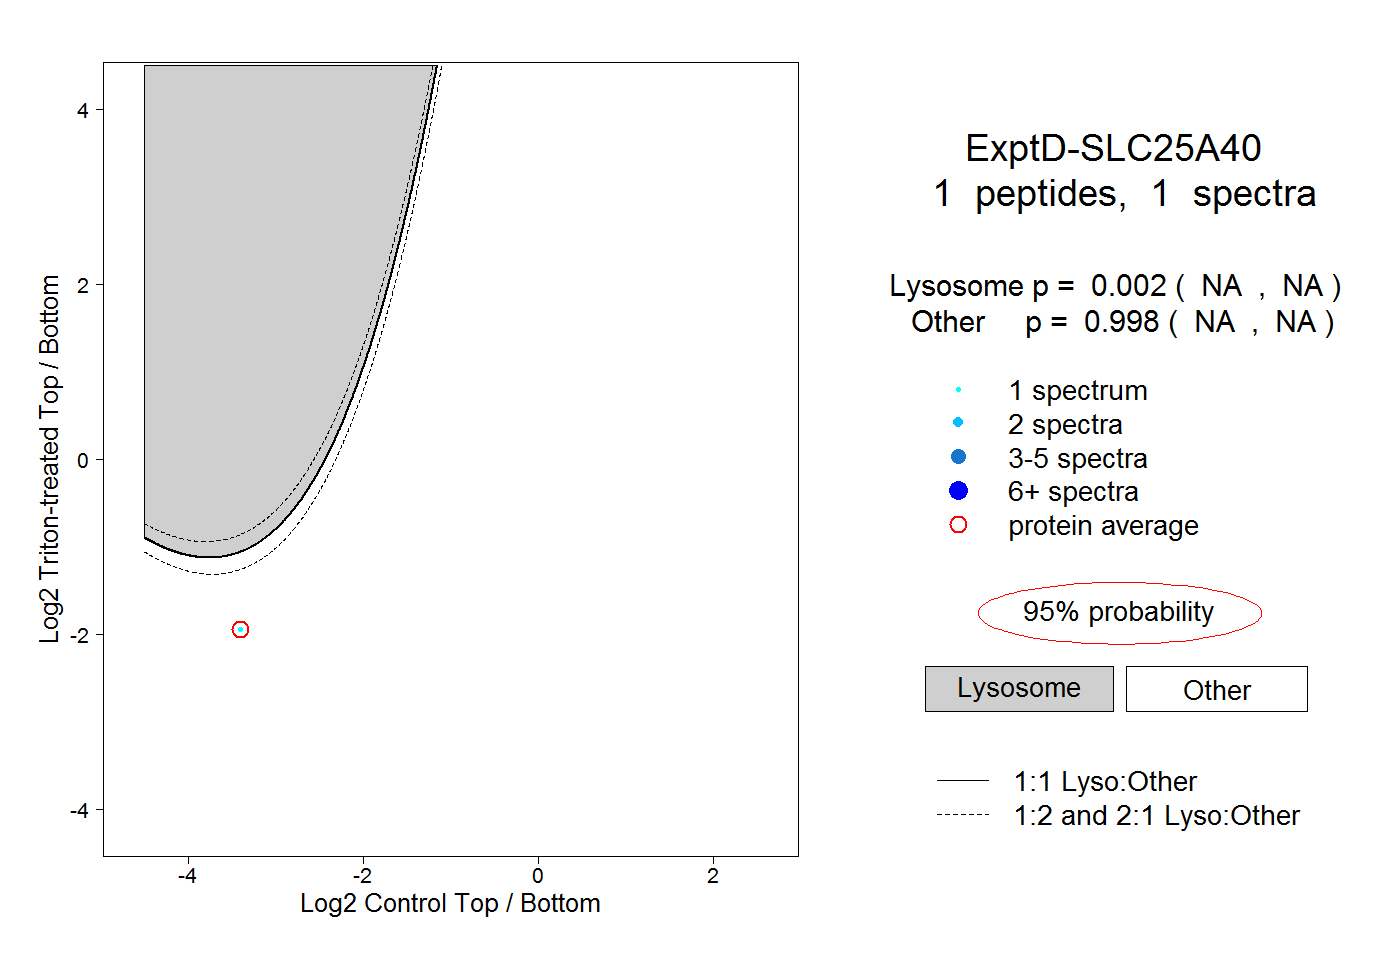 |
0.002 NA | NA |
0.998 NA | NA |