15
15peptides
spectra
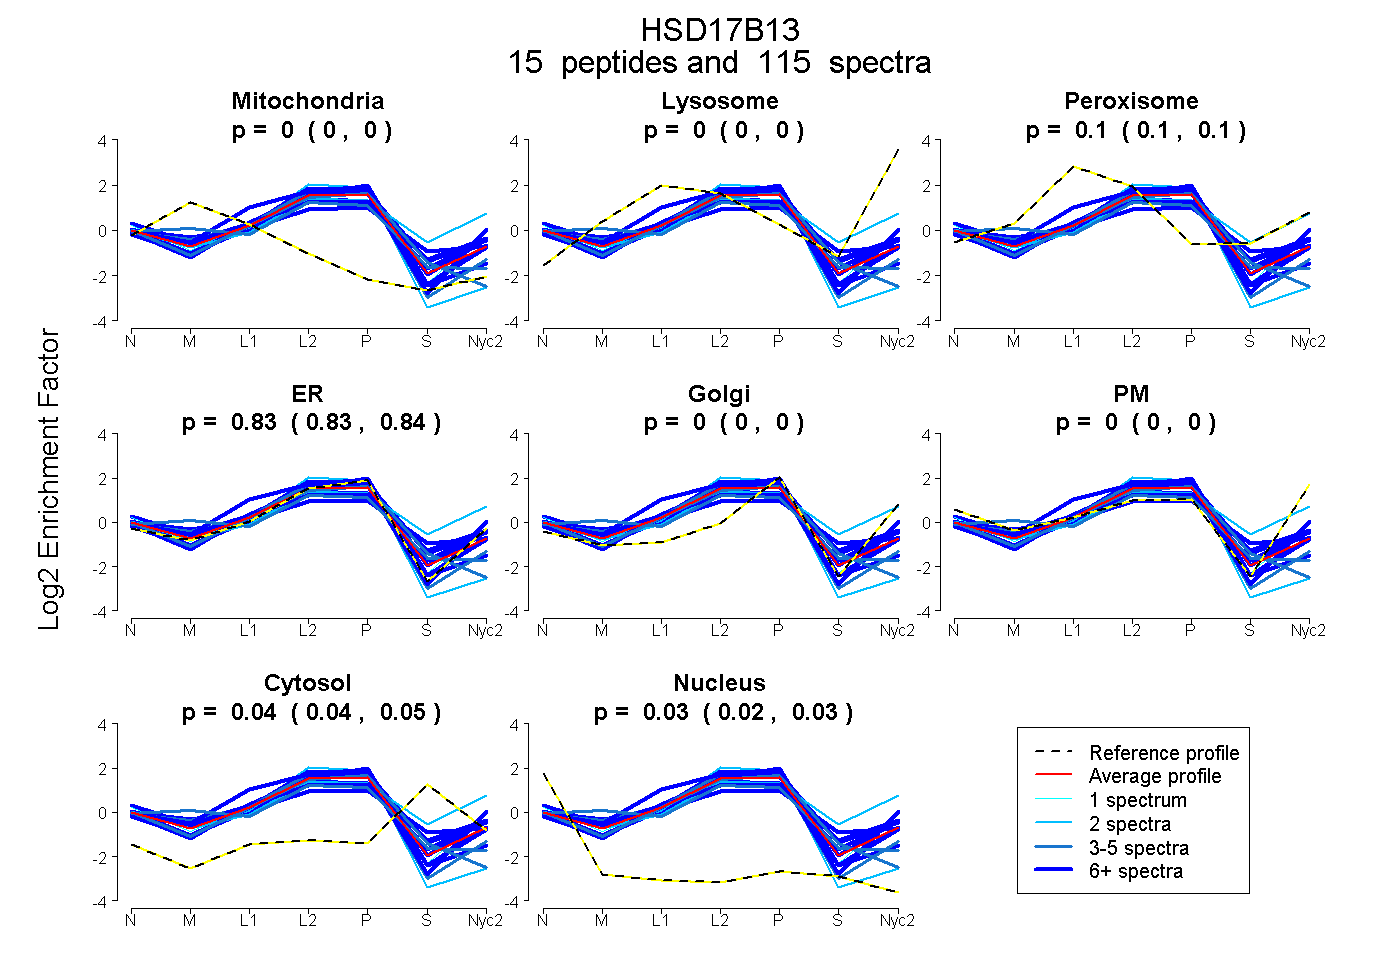
0.000 | 0.000
0.000 | 0.000
0.097 | 0.104
0.826 | 0.835
0.000 | 0.000
0.000 | 0.000
0.036 | 0.047
0.023 | 0.029
14peptides
spectra
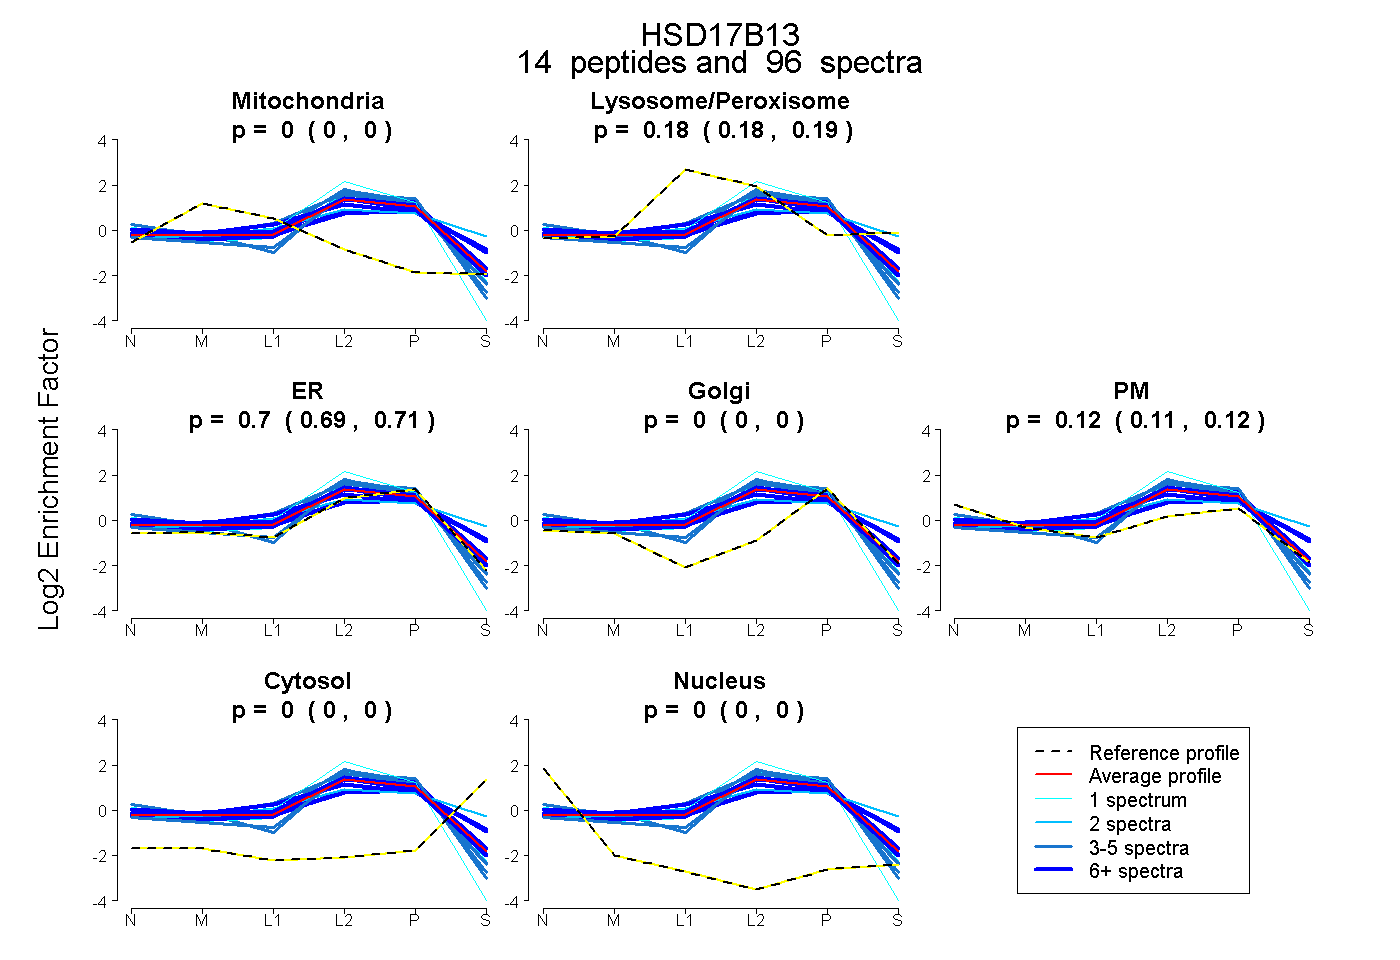
0.000 | 0.000
0.179 | 0.190
0.688 | 0.707
0.000 | 0.000
0.109 | 0.123
0.000 | 0.000
0.000 | 0.000