 15
15peptides
spectra
0.000 | 0.000
0.000 | 0.000
0.097 | 0.104
0.826 | 0.835
0.000 | 0.000
0.000 | 0.000
0.036 | 0.047
0.023 | 0.029
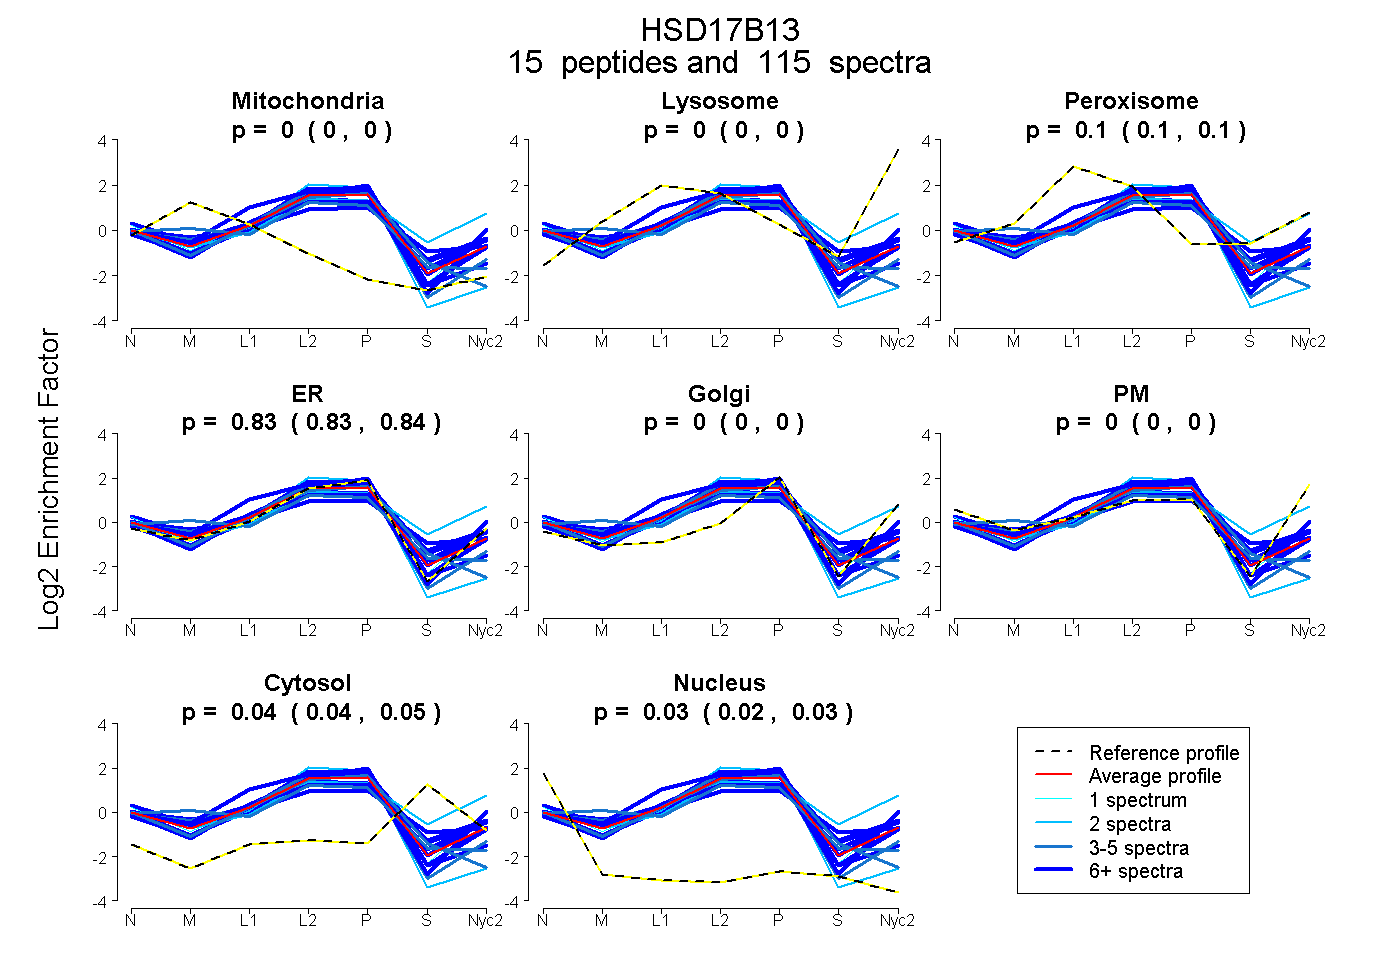
| Plot | Mito | Lyso | Perox | ER | Golgi | PM | Cytosol | Nucleus | |||||
| Expt A |
15 peptides |
115 spectra |
|
0.000 0.000 | 0.000 |
0.000 0.000 | 0.000 |
0.101 0.097 | 0.104 |
0.831 0.826 | 0.835 |
0.000 0.000 | 0.000 |
0.000 0.000 | 0.000 |
0.042 0.036 | 0.047 |
0.026 0.023 | 0.029 |
| 4 spectra, TSCLCPVFVNTGFTK | 0.236 | 0.000 | 0.000 | 0.699 | 0.000 | 0.000 | 0.065 | 0.000 | ||
| 2 spectra, NSGHIVTVASVCGHR | 0.000 | 0.120 | 0.060 | 0.379 | 0.000 | 0.241 | 0.200 | 0.000 | ||
| 10 spectra, LWPVLEPDEVAR | 0.000 | 0.000 | 0.075 | 0.888 | 0.000 | 0.000 | 0.037 | 0.000 | ||
| 2 spectra, LGAVVHVFVVDCSNR | 0.022 | 0.000 | 0.000 | 0.907 | 0.000 | 0.000 | 0.000 | 0.071 | ||
| 4 spectra, VIPYLIPYCSSK | 0.000 | 0.000 | 0.023 | 0.796 | 0.000 | 0.000 | 0.096 | 0.086 | ||
| 18 spectra, SVAGQTVLITGAGHGIGR | 0.000 | 0.000 | 0.188 | 0.674 | 0.000 | 0.000 | 0.138 | 0.000 | ||
| 8 spectra, IQNIQFEAIVGHR | 0.036 | 0.000 | 0.042 | 0.906 | 0.000 | 0.000 | 0.000 | 0.017 | ||
| 17 spectra, ALLPSMLR | 0.000 | 0.000 | 0.013 | 0.965 | 0.000 | 0.000 | 0.009 | 0.013 | ||
| 1 spectrum, DEEITK | 0.000 | 0.000 | 0.041 | 0.808 | 0.000 | 0.151 | 0.000 | 0.000 | ||
| 6 spectra, SVDQVK | 0.000 | 0.000 | 0.160 | 0.777 | 0.000 | 0.063 | 0.000 | 0.000 | ||
| 7 spectra, LVLWDISK | 0.000 | 0.000 | 0.000 | 0.955 | 0.000 | 0.000 | 0.000 | 0.045 | ||
| 12 spectra, FFIPQR | 0.000 | 0.000 | 0.070 | 0.805 | 0.000 | 0.000 | 0.125 | 0.000 | ||
| 4 spectra, SLIDGILTNK | 0.105 | 0.000 | 0.000 | 0.895 | 0.000 | 0.000 | 0.000 | 0.000 | ||
| 7 spectra, ALTAELDTLGK | 0.000 | 0.000 | 0.206 | 0.571 | 0.000 | 0.000 | 0.165 | 0.058 | ||
| 13 spectra, HGVEETAAK | 0.045 | 0.000 | 0.119 | 0.725 | 0.000 | 0.035 | 0.077 | 0.000 |
| Plot | Mito | Lyso or Perox | ER | Golgi | PM | Cytosol | Nucleus | ||||||
| Expt B |
14 peptides |
96 spectra |
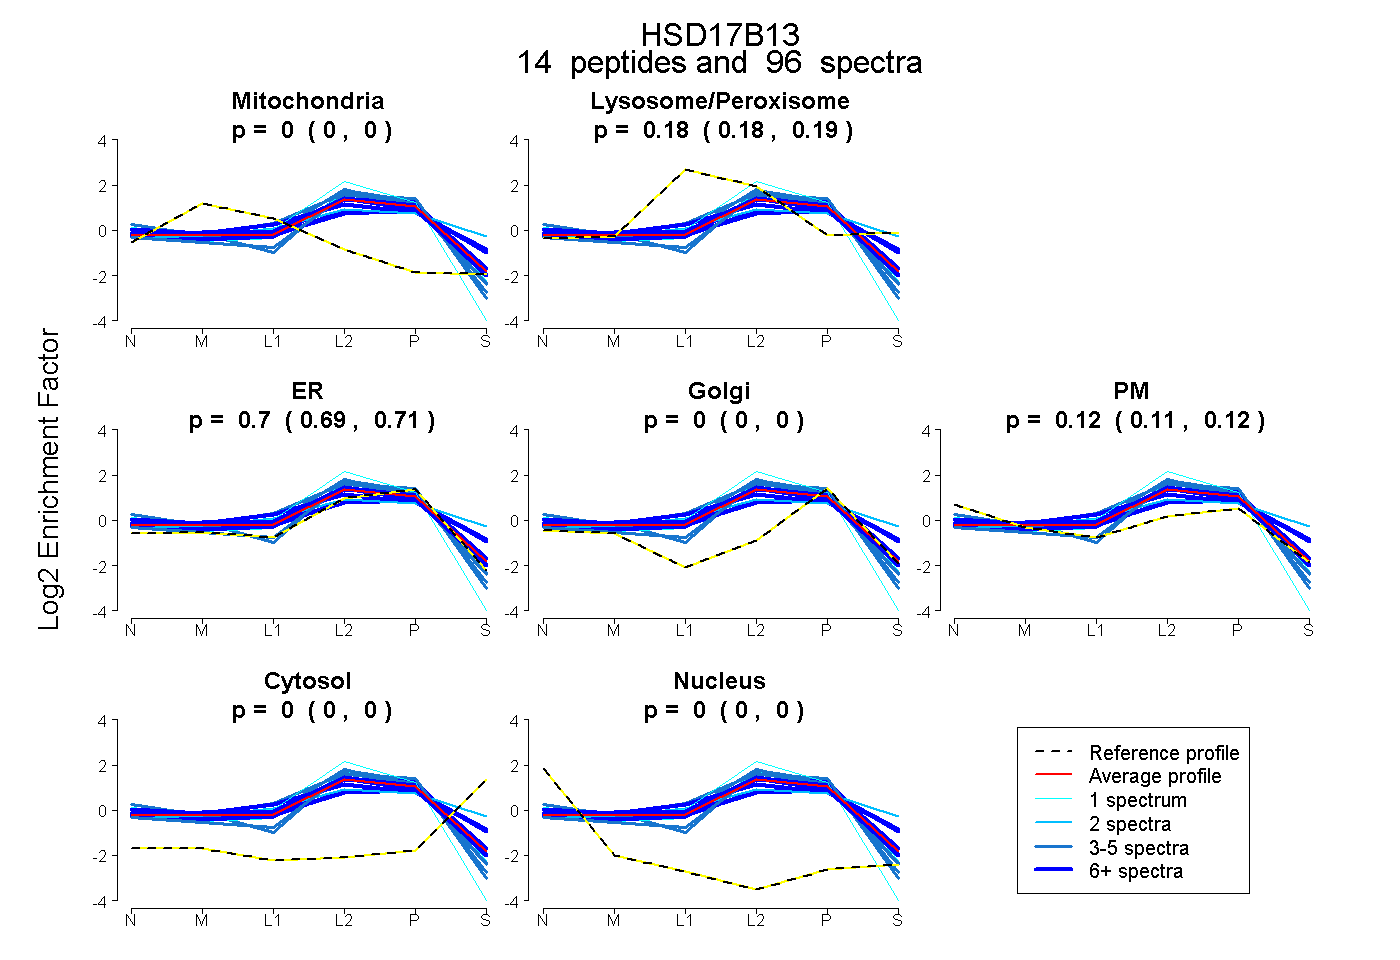 |
0.000 0.000 | 0.000 |
0.185 0.179 | 0.190 |
0.698 0.688 | 0.707 |
0.000 0.000 | 0.000 |
0.117 0.109 | 0.123 |
0.000 0.000 | 0.000 |
0.000 0.000 | 0.000 |
|||
| Plot | Lyso | Other | |||||||||||
| Expt C |
13 peptides |
155 spectra |
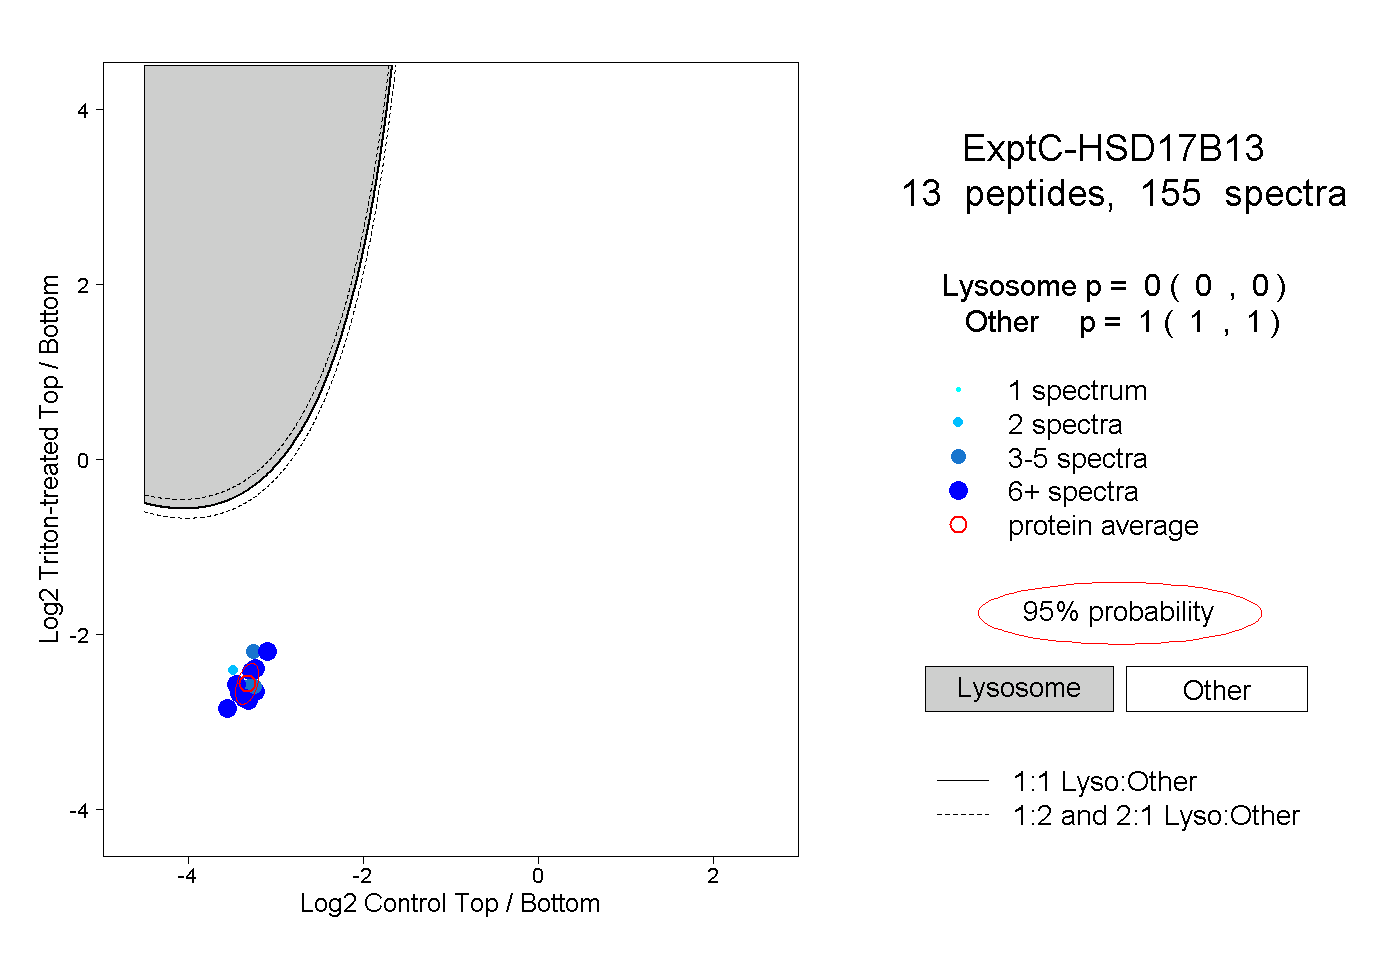 |
0.000 0.000 | 0.000 |
1.000 1.000 | 1.000 |
||||||||
| Plot | Lyso | Other | |||||||||||
| Expt D |
7 peptides |
36 spectra |
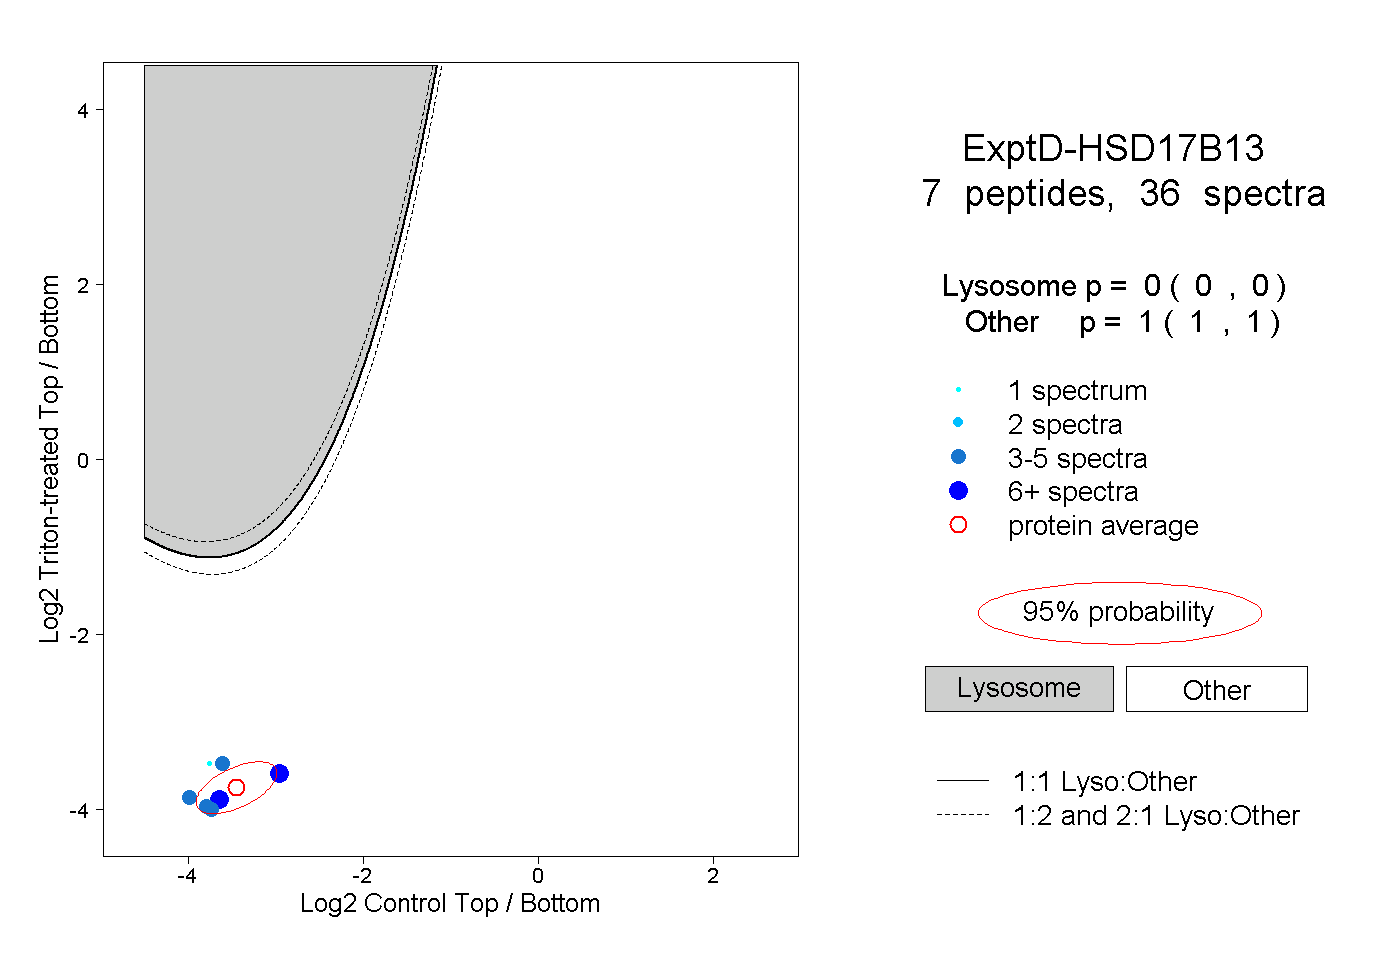 |
0.000 0.000 | 0.000 |
1.000 1.000 | 1.000 |