 2
2peptides
spectra
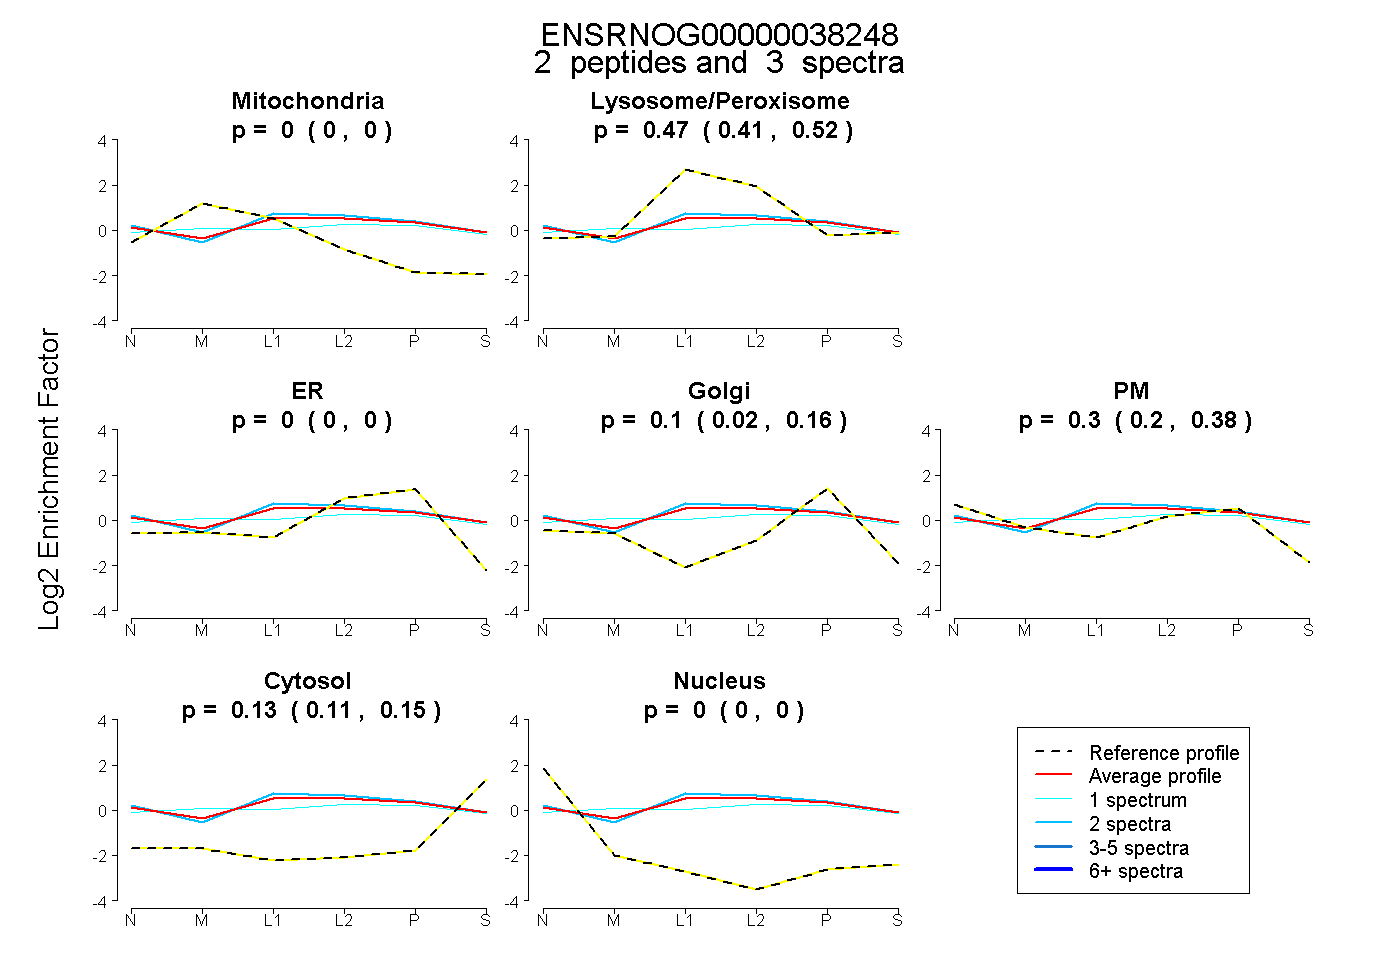
0.000 | 0.000
0.414 | 0.516
0.000 | 0.000
0.023 | 0.162
0.198 | 0.383
0.109 | 0.153
0.000 | 0.000
| Plot | Mito | Lyso or Perox | ER | Golgi | PM | Cytosol | Nucleus | ||||||
| Expt B |
2 peptides |
3 spectra |
|
0.000 0.000 | 0.000 |
0.472 0.414 | 0.516 |
0.000 0.000 | 0.000 |
0.099 0.023 | 0.162 |
0.297 0.198 | 0.383 |
0.133 0.109 | 0.153 |
0.000 0.000 | 0.000 |
| 2 spectra, YTGVPDR | 0.000 | 0.510 | 0.000 | 0.075 | 0.301 | 0.114 | 0.000 | |||
| 1 spectrum, LLIYGASNR | 0.011 | 0.393 | 0.000 | 0.153 | 0.276 | 0.167 | 0.000 |
| Plot | Lyso | Other | |||||||||||
| Expt C |
1 peptide |
4 spectra |
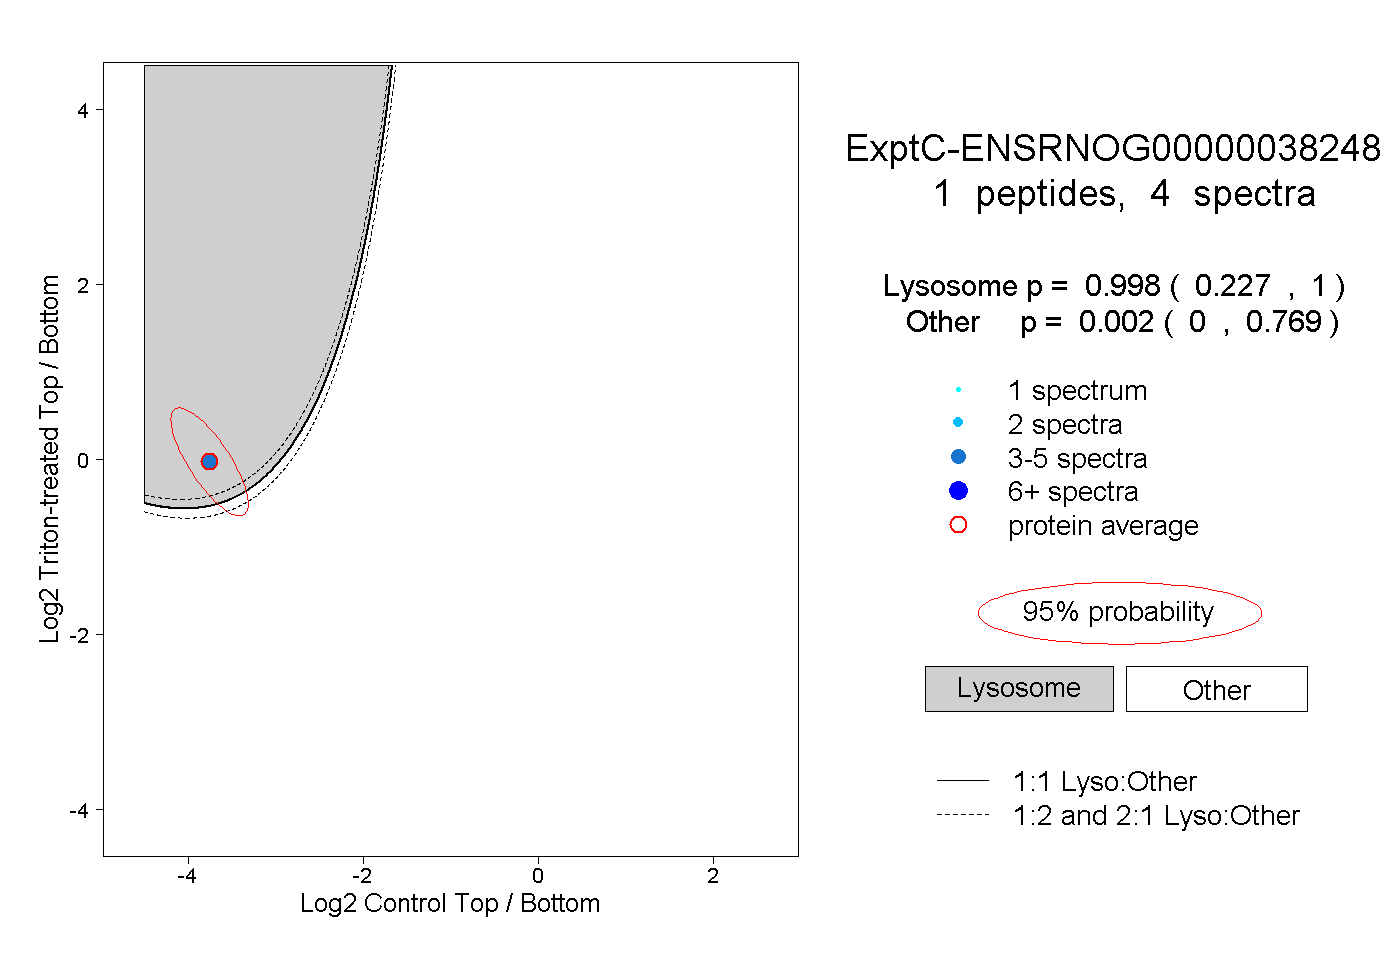 |
0.998 0.227 | 1.000 |
0.002 0.000 | 0.769 |