 2
2peptides
spectra
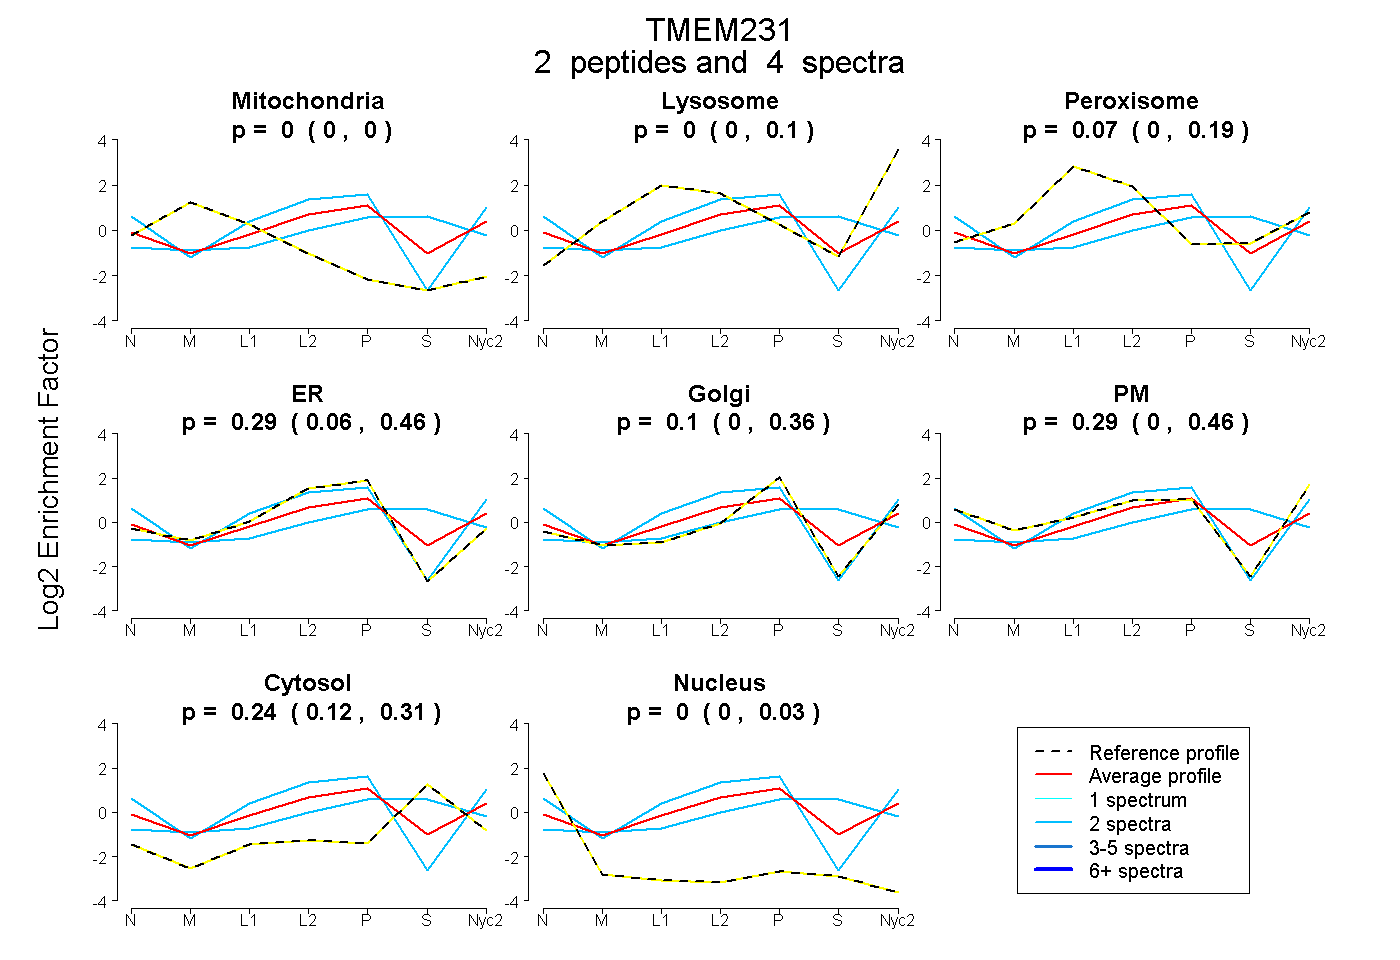
0.000 | 0.000
0.000 | 0.100
0.000 | 0.194
0.059 | 0.460
0.000 | 0.363
0.000 | 0.456
0.125 | 0.313
0.000 | 0.025
3peptides
spectra
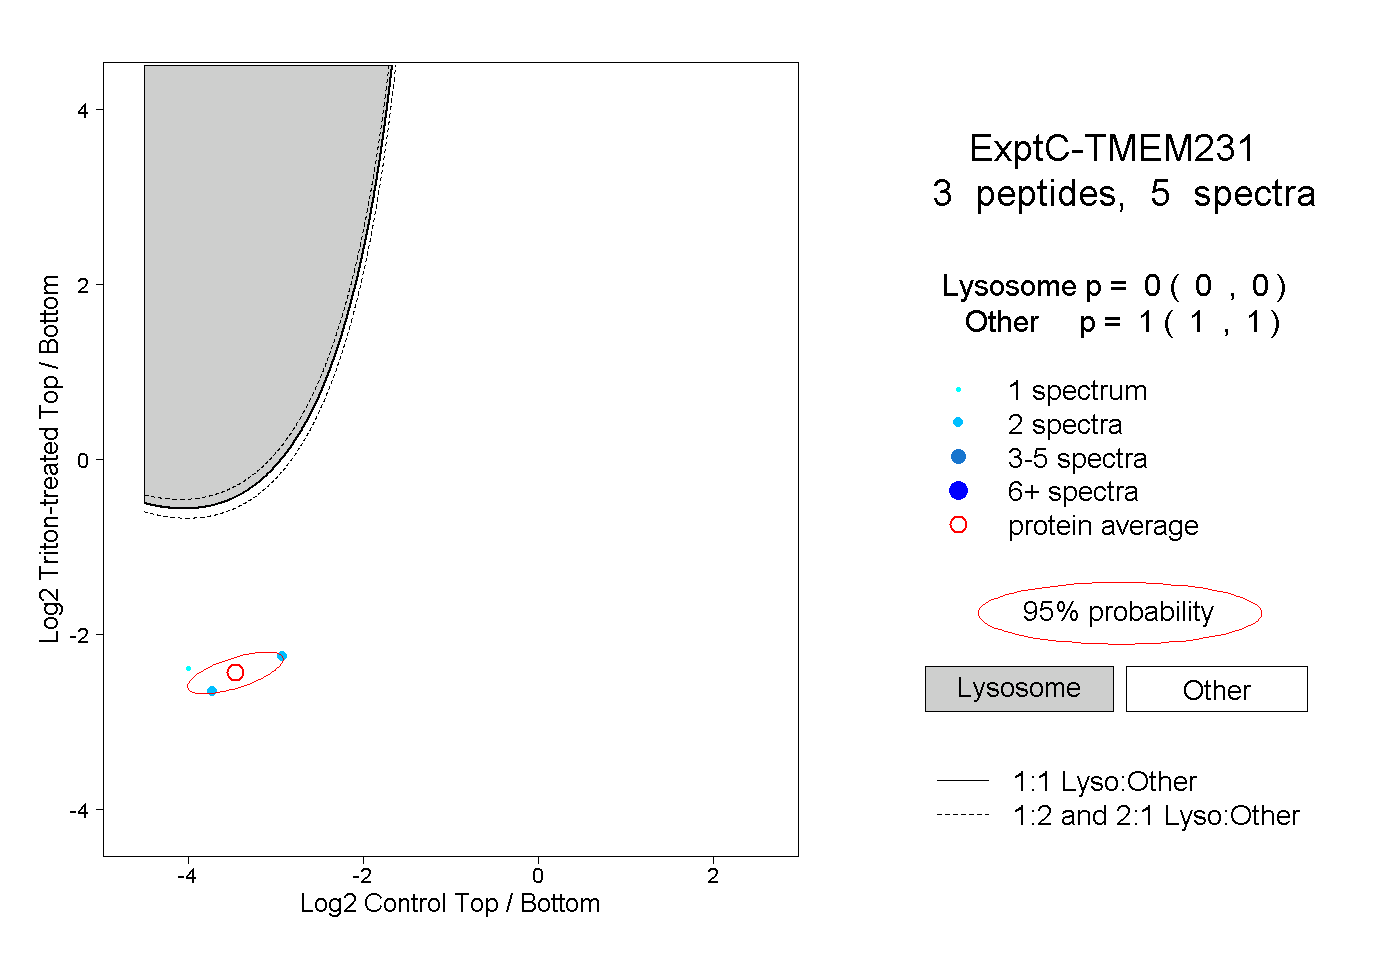
0.000 | 0.000
1.000 | 1.000
1peptide
spectra
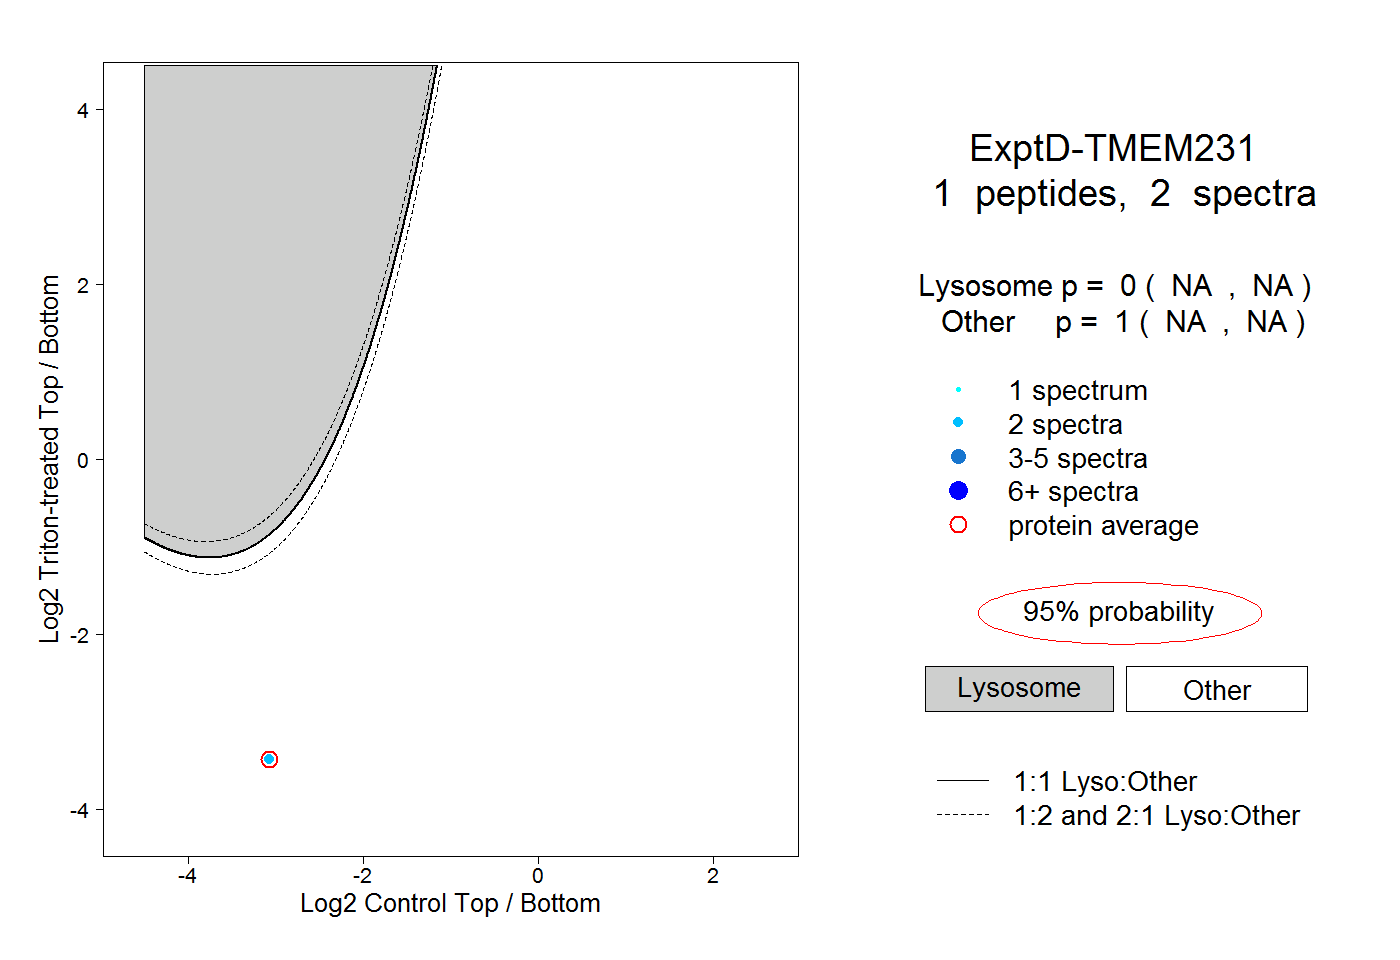
NA | NA
NA | NA