 2
2peptides
spectra
0.085 | 0.232
0.000 | 0.000
0.000 | 0.000
0.000 | 0.000
0.000 | 0.049
0.000 | 0.000
0.114 | 0.214
0.563 | 0.729
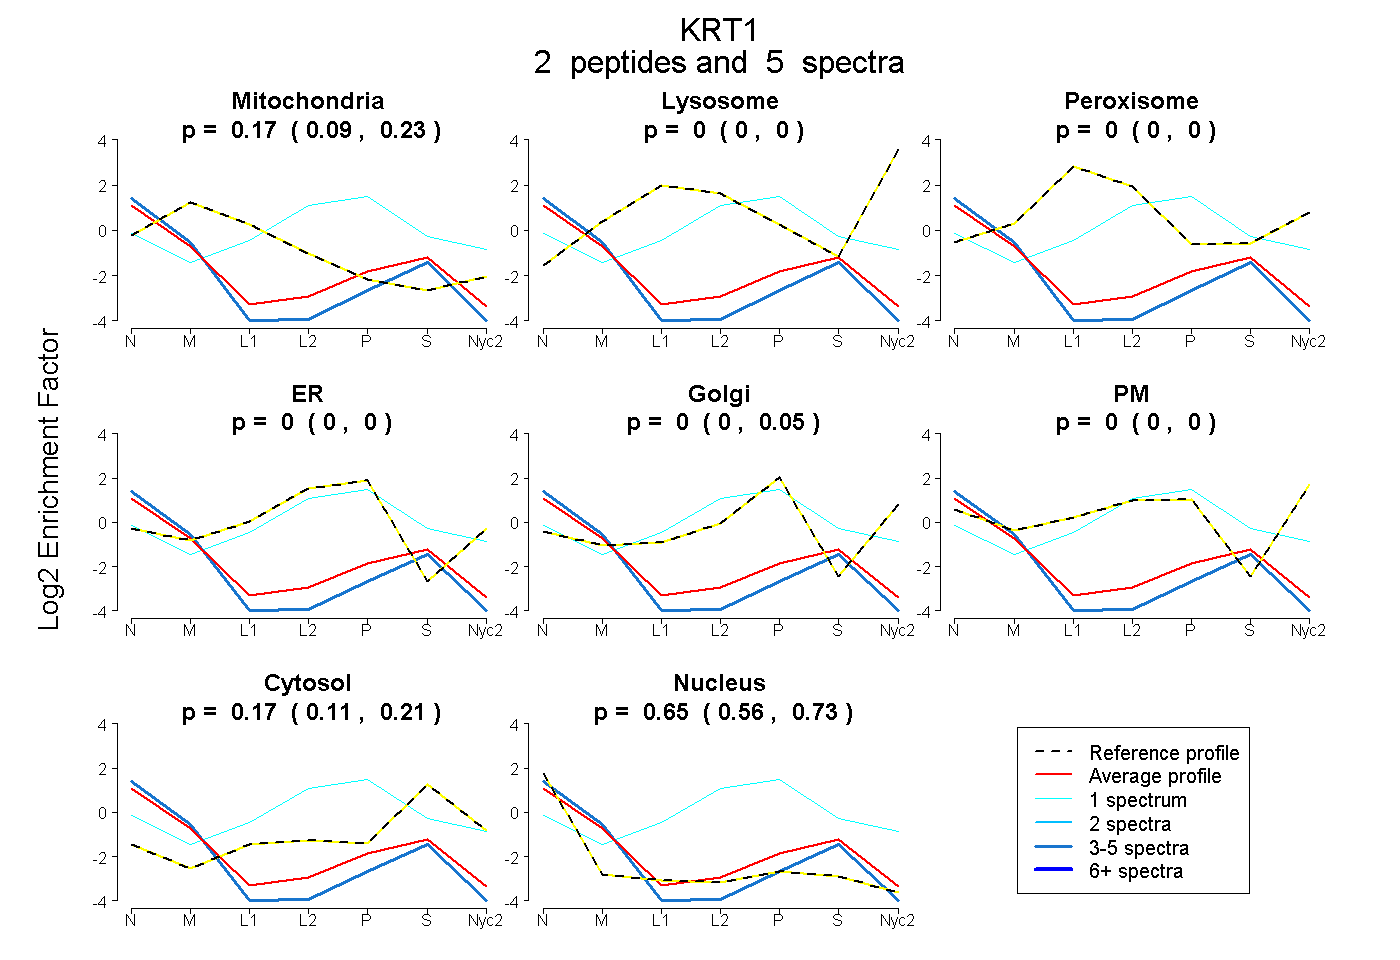
| Plot | Mito | Lyso | Perox | ER | Golgi | PM | Cytosol | Nucleus | |||||
| Expt A |
2 peptides |
5 spectra |
|
0.173 0.085 | 0.232 |
0.000 0.000 | 0.000 |
0.000 0.000 | 0.000 |
0.000 0.000 | 0.000 |
0.000 0.000 | 0.049 |
0.000 0.000 | 0.000 |
0.175 0.114 | 0.214 |
0.652 0.563 | 0.729 |