 4
4peptides
spectra
0.000 | 0.000
0.000 | 0.021
0.012 | 0.078
0.113 | 0.181
0.000 | 0.026
0.746 | 0.821
0.000 | 0.017
0.000 | 0.000
3peptides
spectra
0.000 | 0.000
1.000 | 1.000
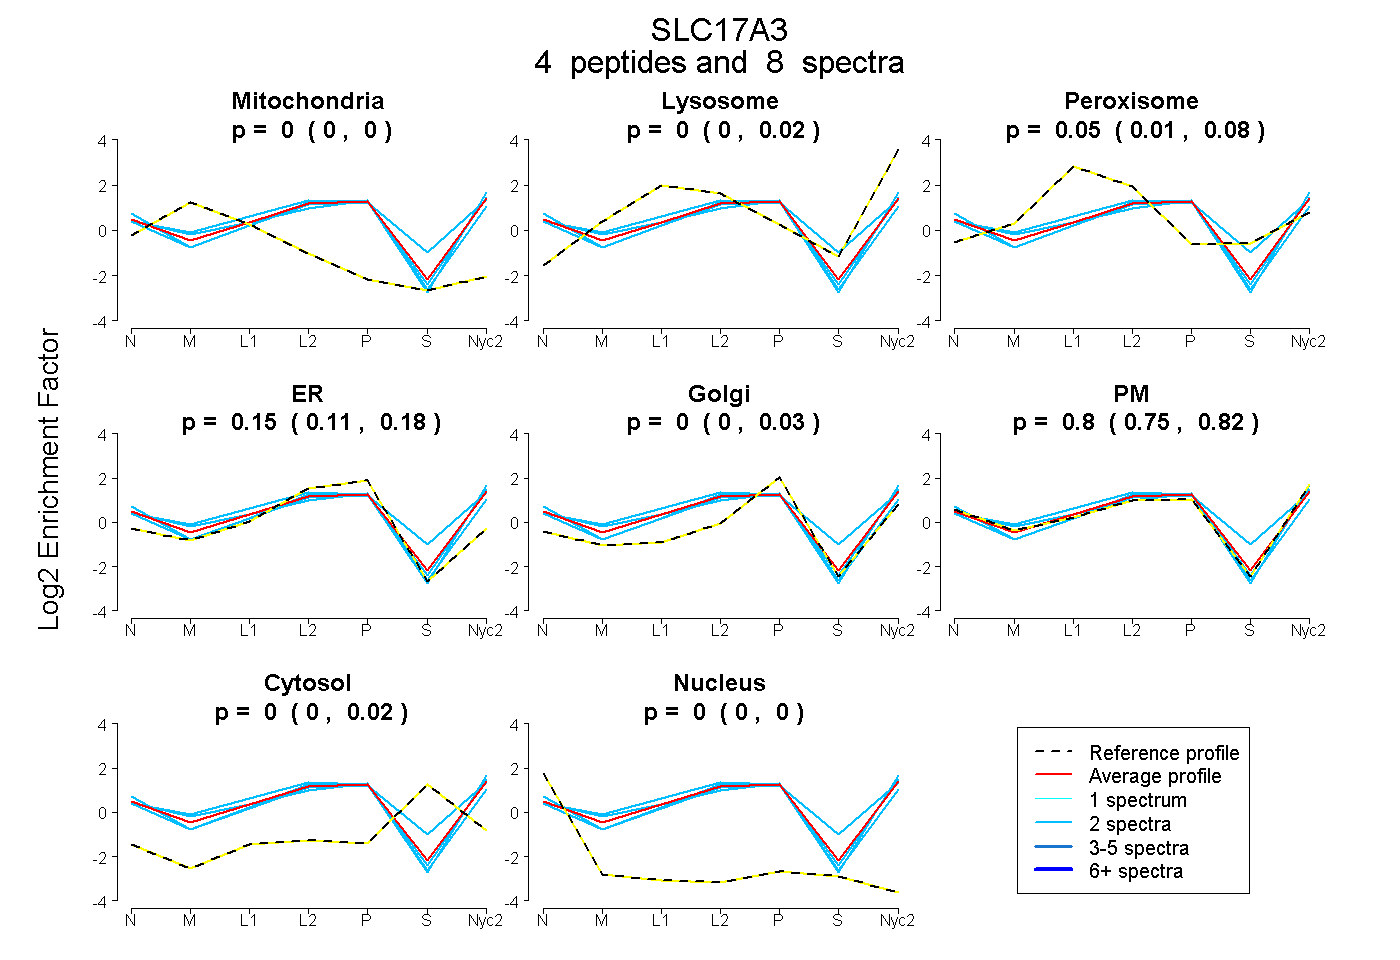
| Plot | Mito | Lyso | Perox | ER | Golgi | PM | Cytosol | Nucleus | |||||
| Expt A |
4 peptides |
8 spectra |
|
0.000 0.000 | 0.000 |
0.000 0.000 | 0.021 |
0.052 0.012 | 0.078 |
0.153 0.113 | 0.181 |
0.000 0.000 | 0.026 |
0.795 0.746 | 0.821 |
0.000 0.000 | 0.017 |
0.000 0.000 | 0.000 |
||
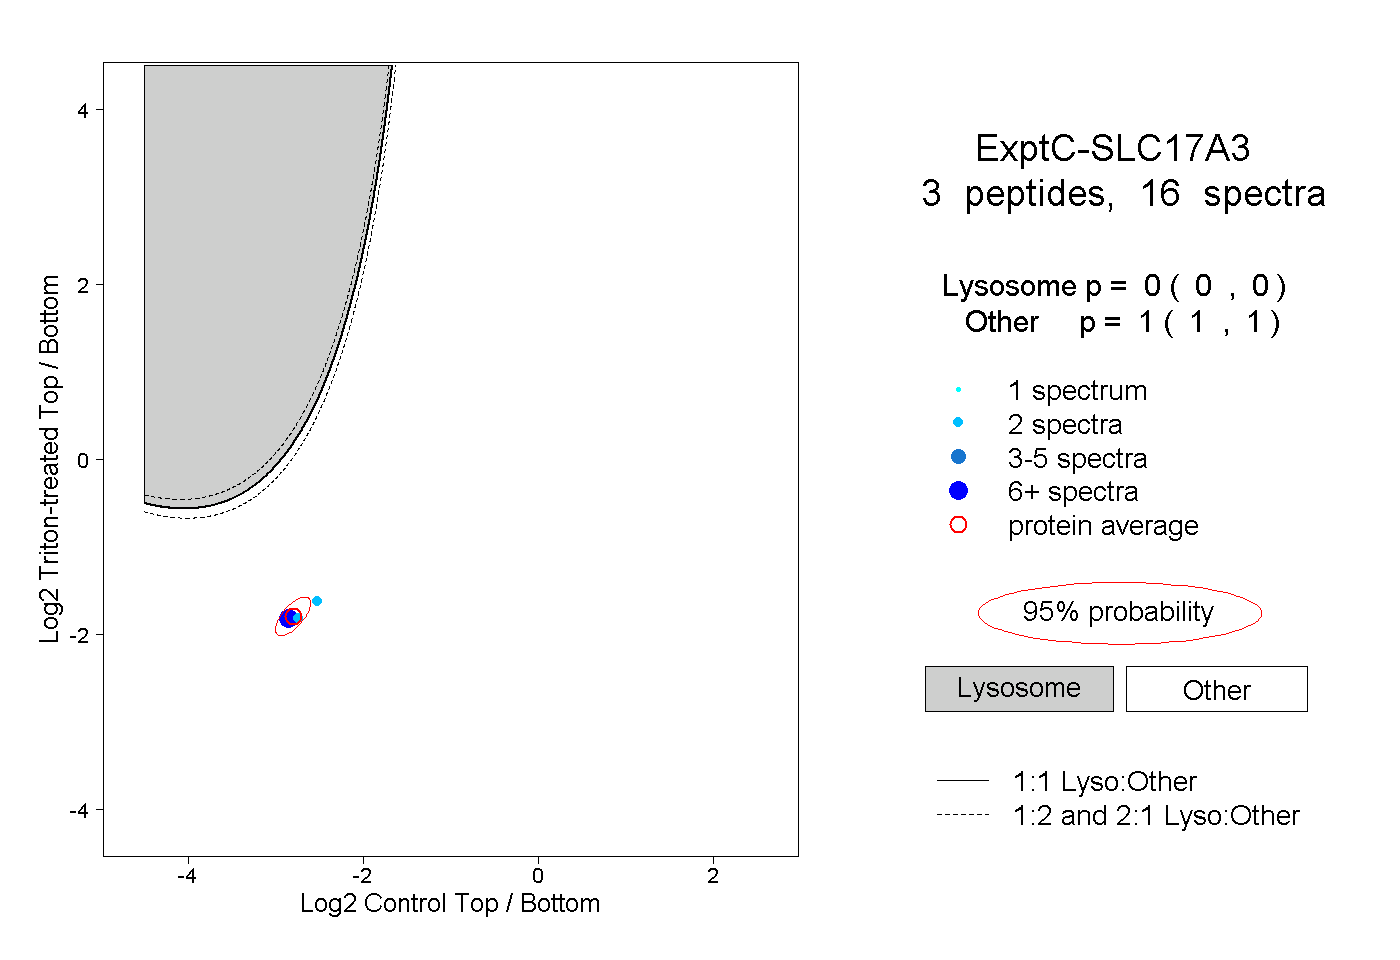
| Plot | Lyso | Other | |||||||||||
| Expt C |
3 peptides |
16 spectra |
|
0.000 0.000 | 0.000 |
1.000 1.000 | 1.000 |