 1
1peptide
spectra
0.187 | 0.227
0.000 | 0.000
0.000 | 0.000
0.000 | 0.000
0.000 | 0.000
0.283 | 0.312
0.348 | 0.371
0.118 | 0.143
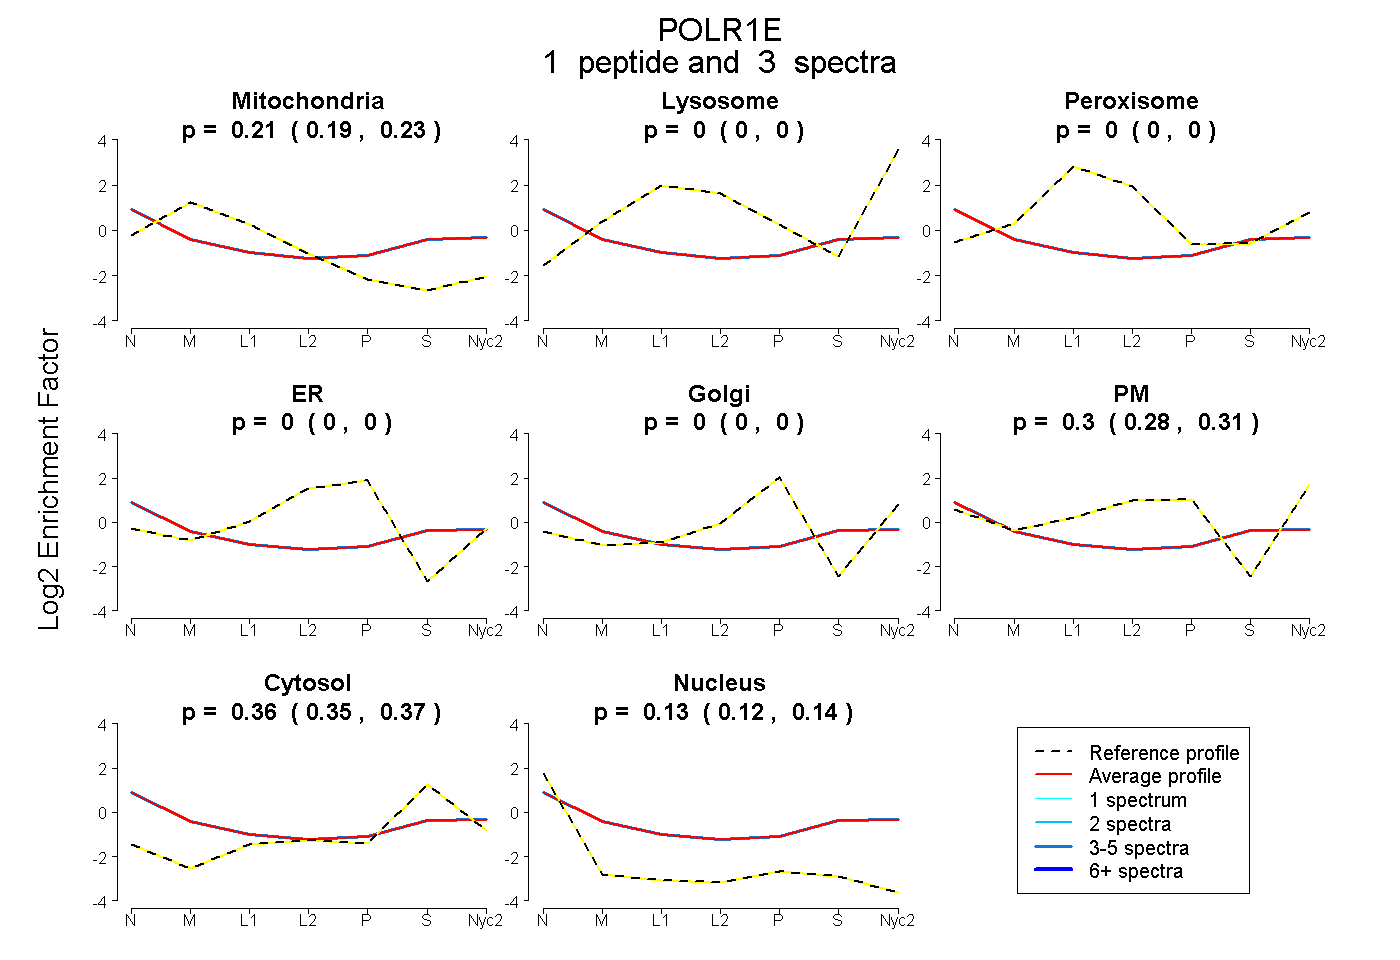
| Plot | Mito | Lyso | Perox | ER | Golgi | PM | Cytosol | Nucleus | |||||
| Expt A |
1 peptide |
3 spectra |
|
0.208 0.187 | 0.227 |
0.000 0.000 | 0.000 |
0.000 0.000 | 0.000 |
0.000 0.000 | 0.000 |
0.000 0.000 | 0.000 |
0.298 0.283 | 0.312 |
0.361 0.348 | 0.371 |
0.132 0.118 | 0.143 |