 6
6peptides
spectra
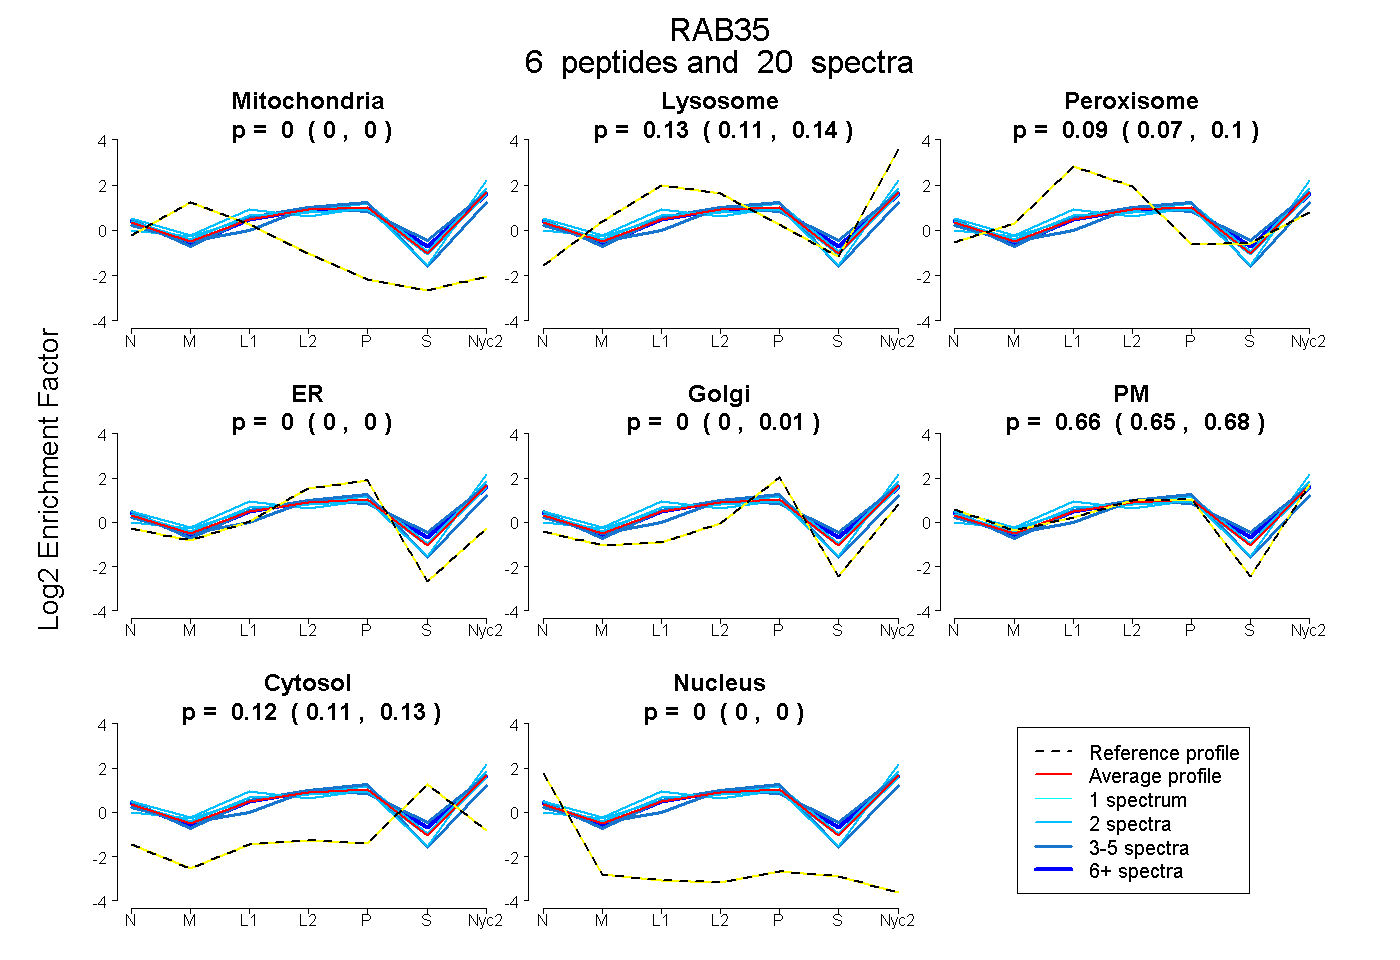
0.000 | 0.000
0.107 | 0.140
0.070 | 0.103
0.000 | 0.000
0.000 | 0.007
0.646 | 0.680
0.112 | 0.130
0.000 | 0.000
4peptides
spectra
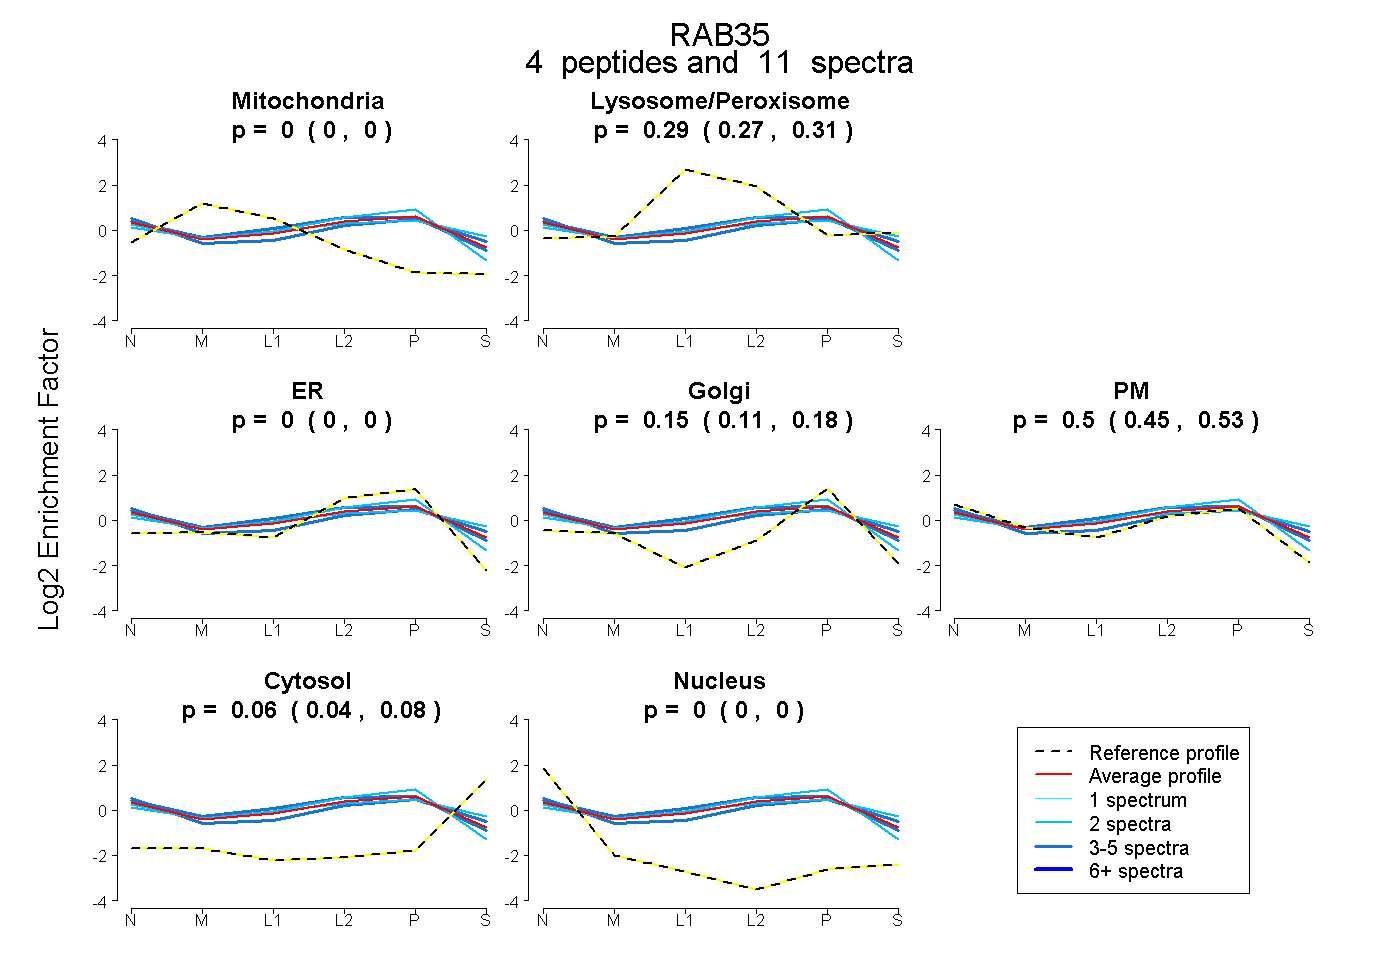
0.000 | 0.000
0.271 | 0.308
0.000 | 0.000
0.113 | 0.180
0.450 | 0.534
0.045 | 0.080
0.000 | 0.000
8peptides
spectra
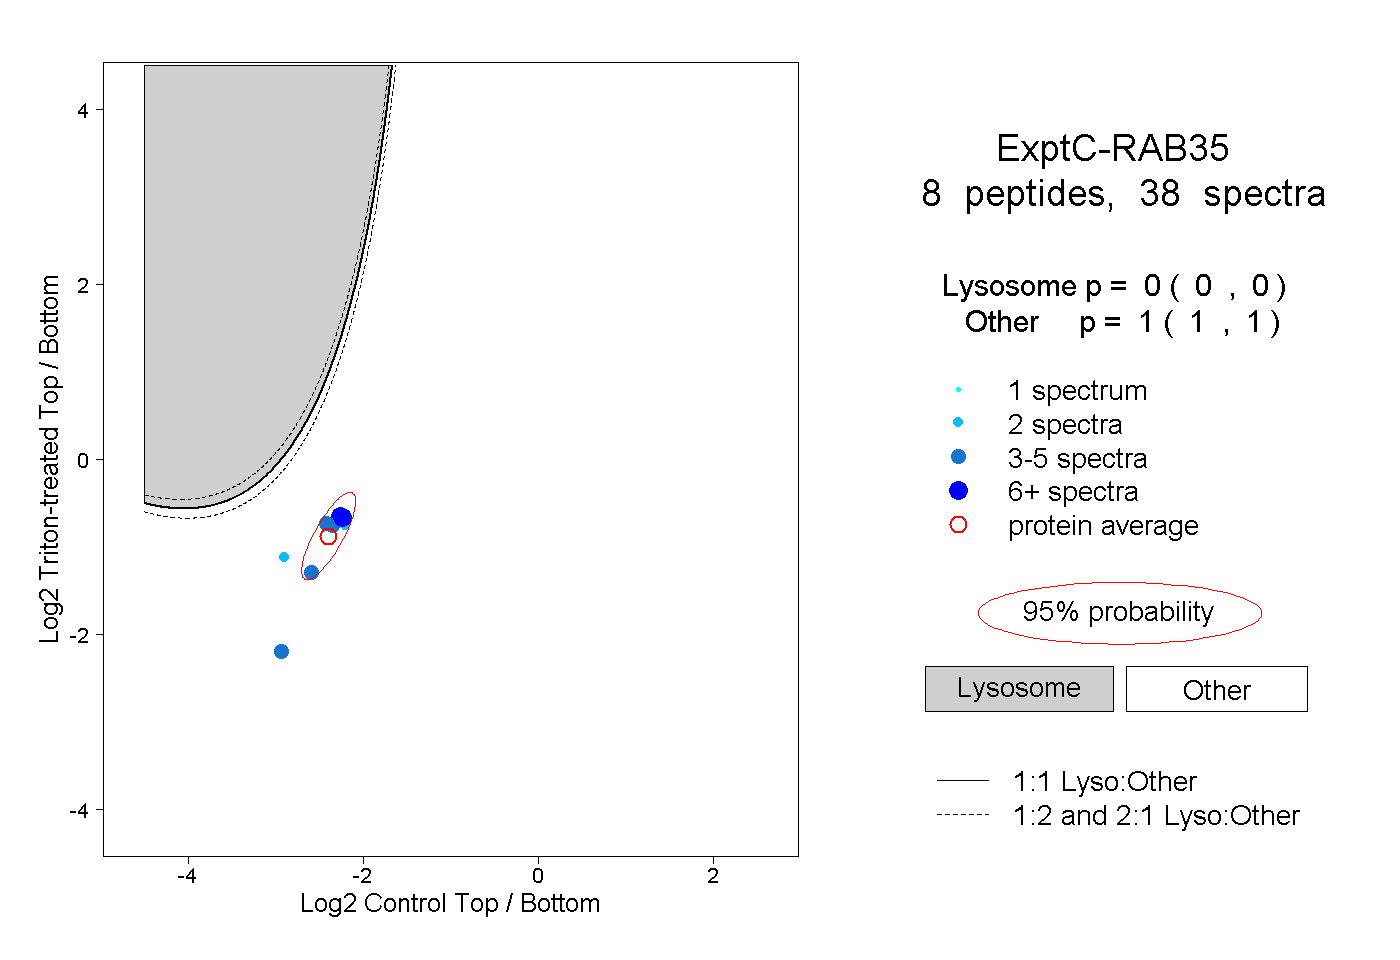
0.000 | 0.000
1.000 | 1.000
4peptides
spectra
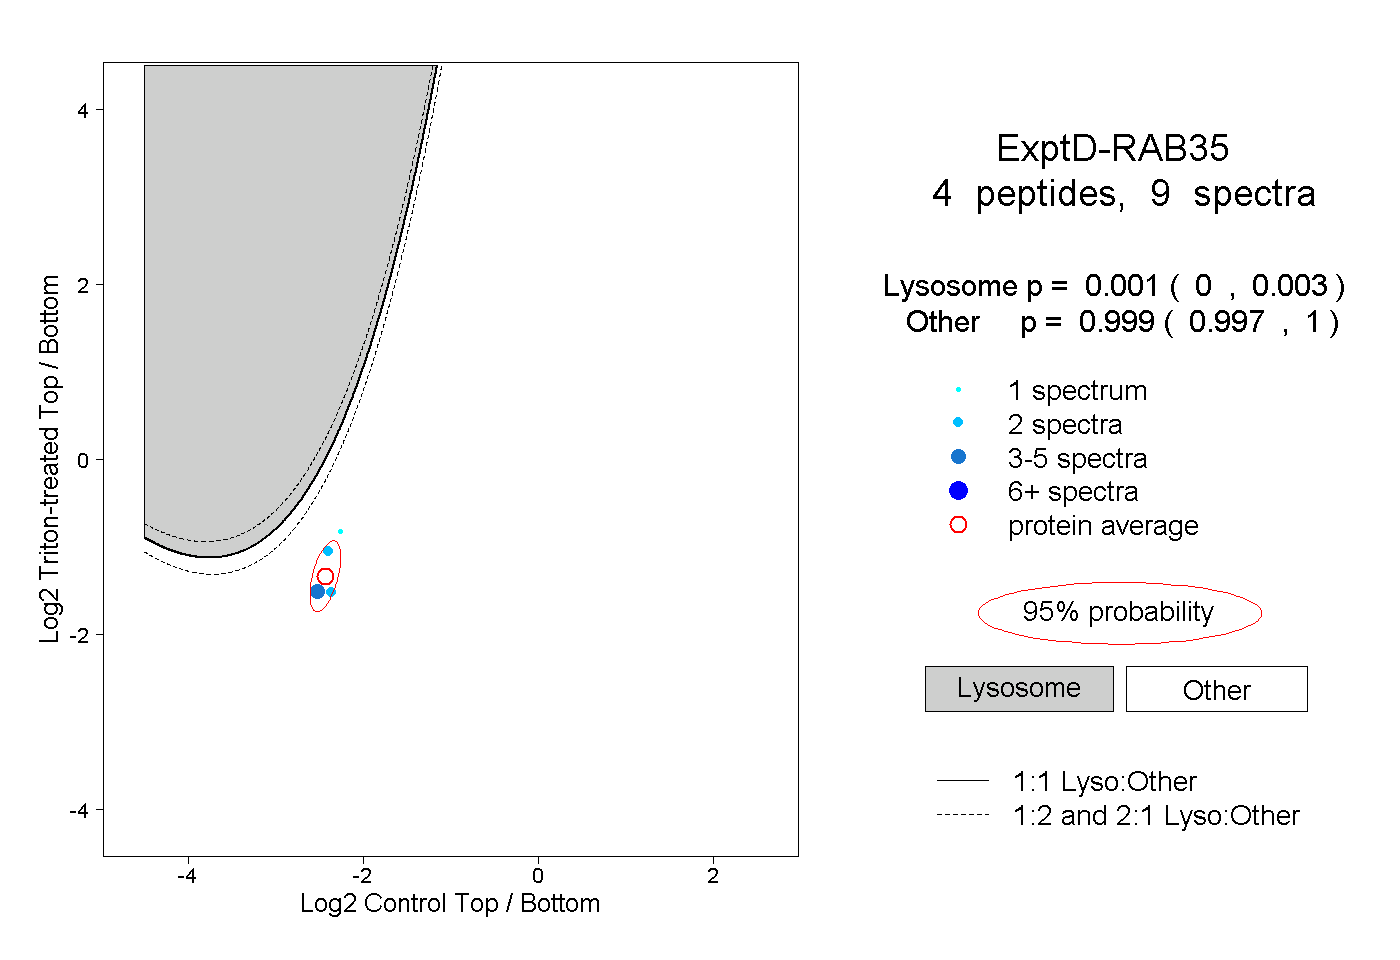
0.000 | 0.003
0.997 | 1.000