MLLT4
[ENSRNOP00000029044]
Main page
| | | Plot |
Mito |
Lyso |
|
Perox |
ER |
Golgi |
PM |
Cytosol |
Nucleus |
|
| Expt A |
 22
22
peptides |
41
spectra |
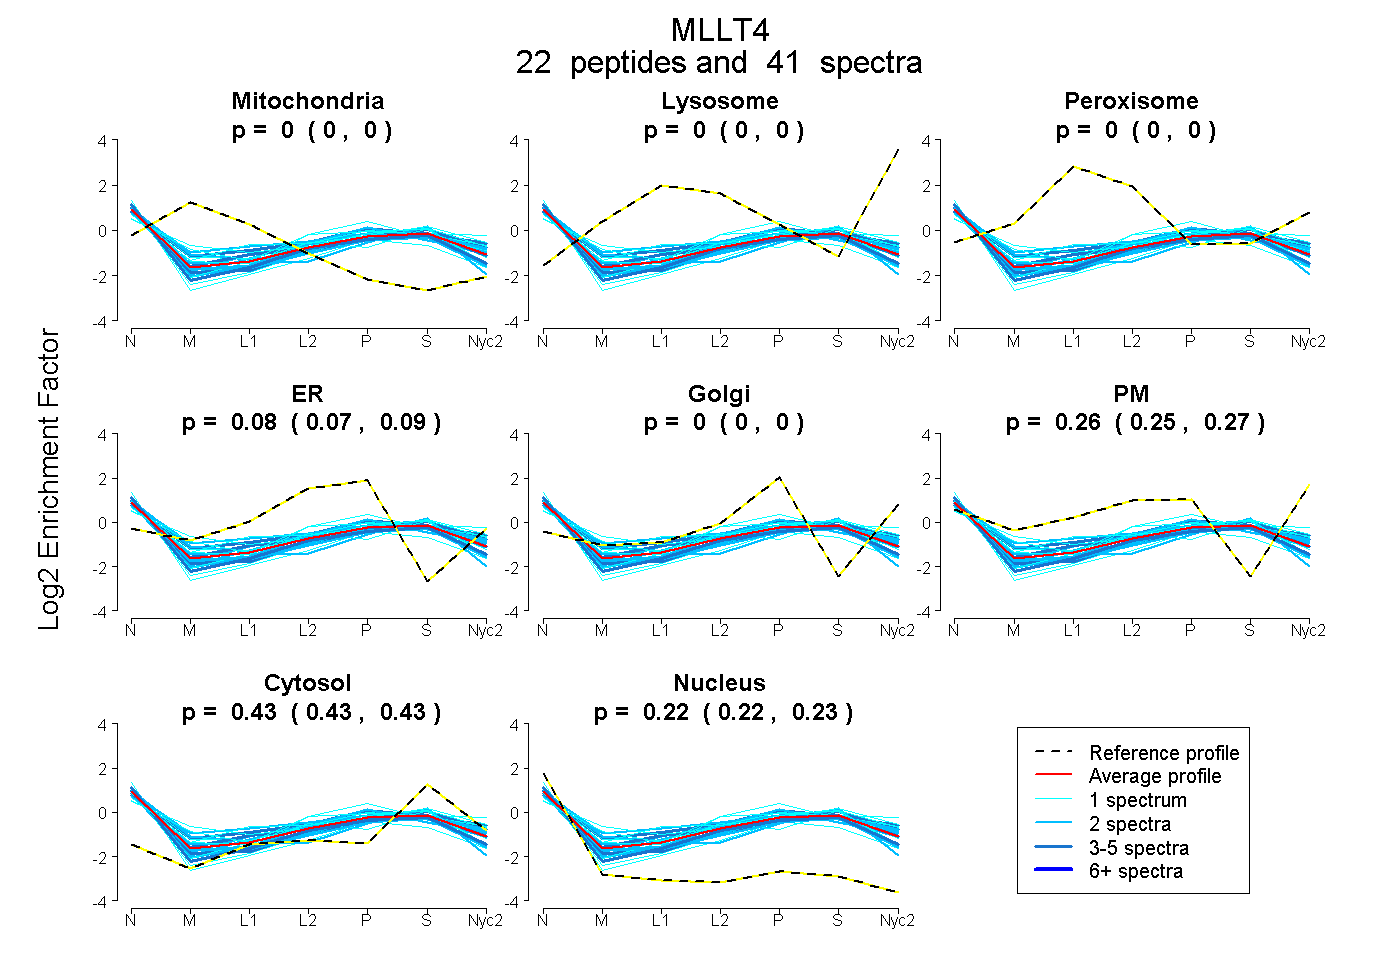 |
0.000
0.000 | 0.000 |
0.000
0.000 | 0.000 |
|
0.000
0.000 | 0.000 |
0.084
0.074 | 0.092 |
0.000
0.000 | 0.000 |
0.263
0.253 | 0.272 |
0.430
0.427 | 0.433 |
0.223
0.220 | 0.225 |
|
| | | Plot |
Mito |
|
Lyso or Perox |
|
ER |
Golgi |
PM |
Cytosol |
Nucleus |
|
| Expt B |
4
peptides |
6
spectra |
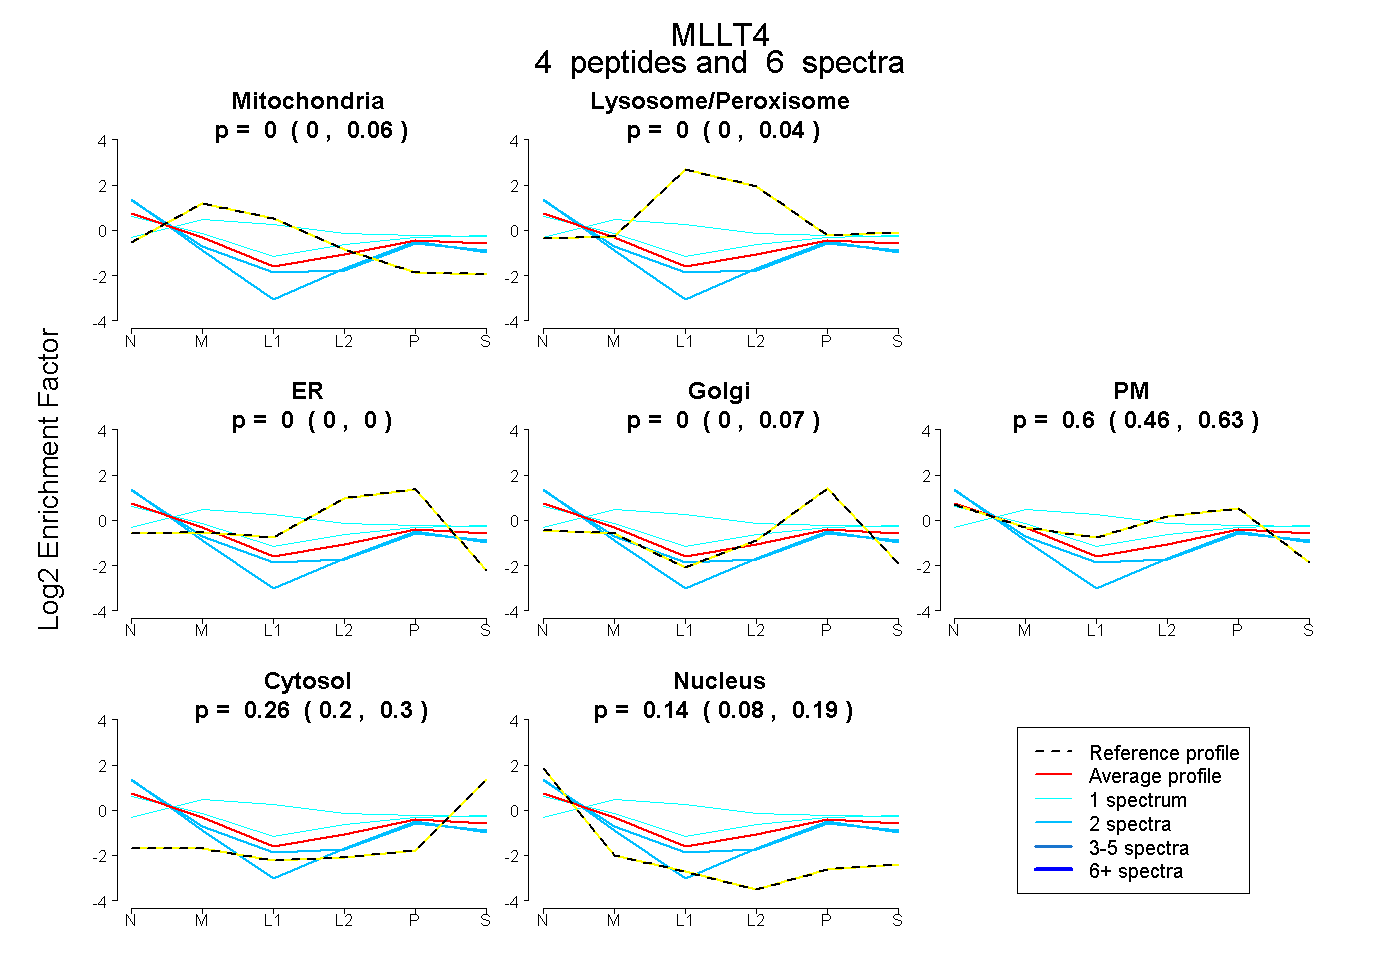 |
0.000
0.000 | 0.063 |
|
0.000
0.000 | 0.041 |
|
0.000
0.000 | 0.000 |
0.000
0.000 | 0.071 |
0.599
0.461 | 0.627 |
0.261
0.197 | 0.298 |
0.139
0.084 | 0.191 |
|
| | | Plot |
|
Lyso |
|
|
|
|
|
|
|
Other |
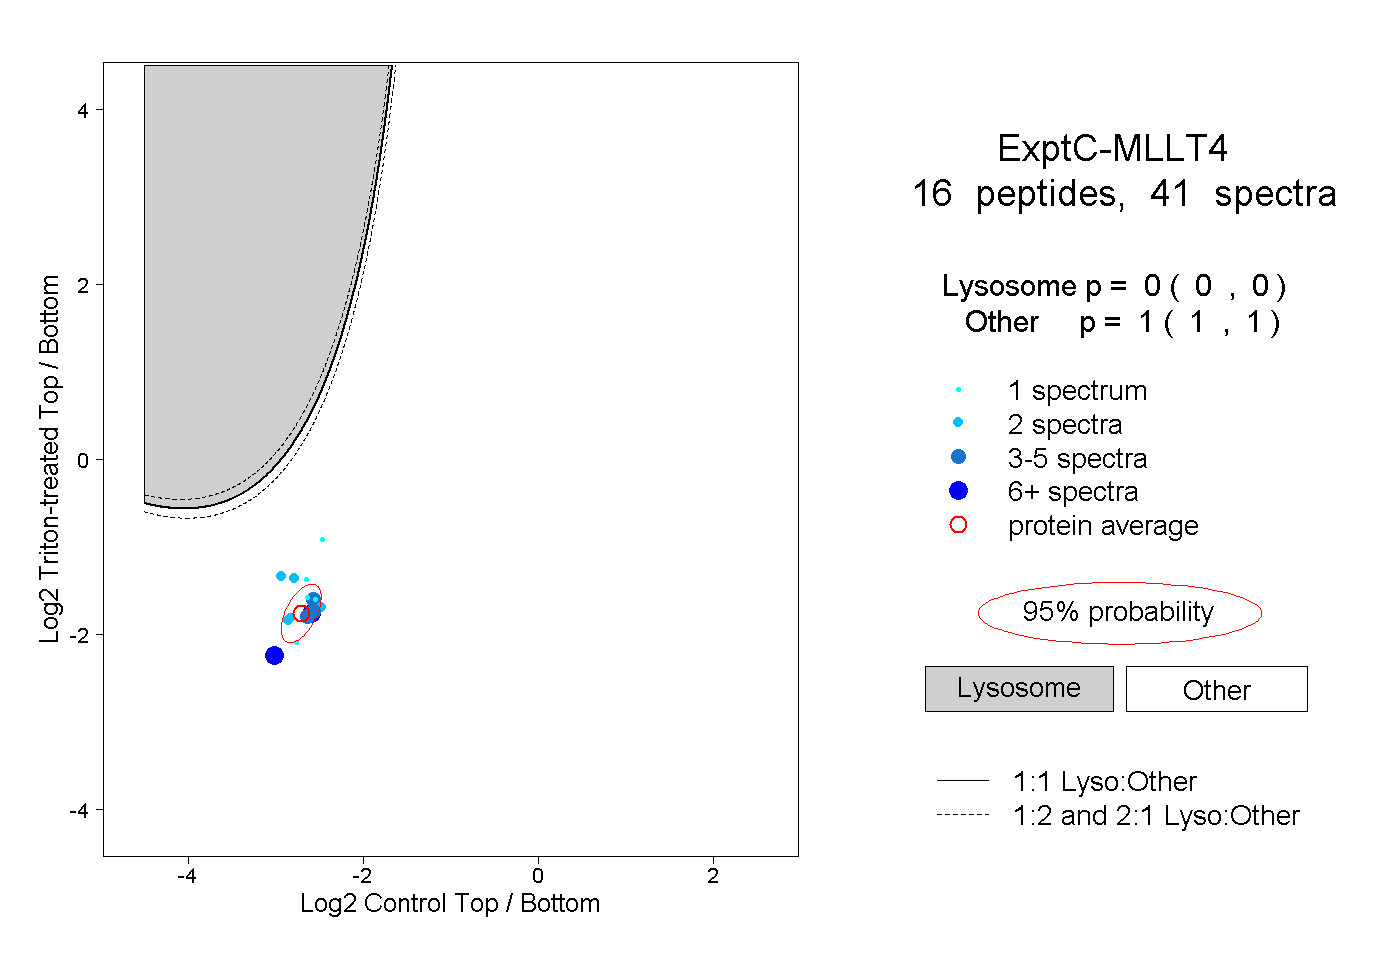
| Expt C |
16
peptides |
41
spectra |
 |
|
0.000
0.000 | 0.000 |
|
|
|
|
|
|
|
1.000
1.000 | 1.000 |
| 2 spectra, LVPHTR |
|
0.000 |
|
|
|
|
|
|
|
1.000 |
| 6 spectra, LQDEER |
|
0.000 |
|
|
|
|
|
|
|
1.000 |
| 1 spectrum, SVTPASTLTK |
|
0.000 |
|
|
|
|
|
|
|
1.000 |
| 1 spectrum, RPPDYIPK |
|
0.000 |
|
|
|
|
|
|
|
1.000 |
| 4 spectra, VSSASSTAER |
|
0.000 |
|
|
|
|
|
|
|
1.000 |
| 1 spectrum, NENDAIPAK |
|
0.000 |
|
|
|
|
|
|
|
1.000 |
| 4 spectra, ELQPQQQPR |
|
0.000 |
|
|
|
|
|
|
|
1.000 |
| 1 spectrum, FVDPIQDHVLSK |
|
0.000 |
|
|
|
|
|
|
|
1.000 |
| 2 spectra, IYADSLKPNIPYK |
|
0.000 |
|
|
|
|
|
|
|
1.000 |
| 2 spectra, LAAGDQLLSVDGR |
|
0.000 |
|
|
|
|
|
|
|
1.000 |
| 2 spectra, GGAADVDGR |
|
0.000 |
|
|
|
|
|
|
|
1.000 |
| 3 spectra, SMDAETYVDGQR |
|
0.000 |
|
|
|
|
|
|
|
1.000 |
| 8 spectra, DYCIAR |
|
0.000 |
|
|
|
|
|
|
|
1.000 |
| 1 spectrum, AQSNGPEK |
|
0.000 |
|
|
|
|
|
|
|
1.000 |
| 2 spectra, AIAVVNK |
|
0.000 |
|
|
|
|
|
|
|
1.000 |
| 1 spectrum, QQQLEEMR |
|
0.000 |
|
|
|
|
|
|
|
1.000 |
| | | Plot |
|
Lyso |
|
|
|
|
|
|
|
Other |
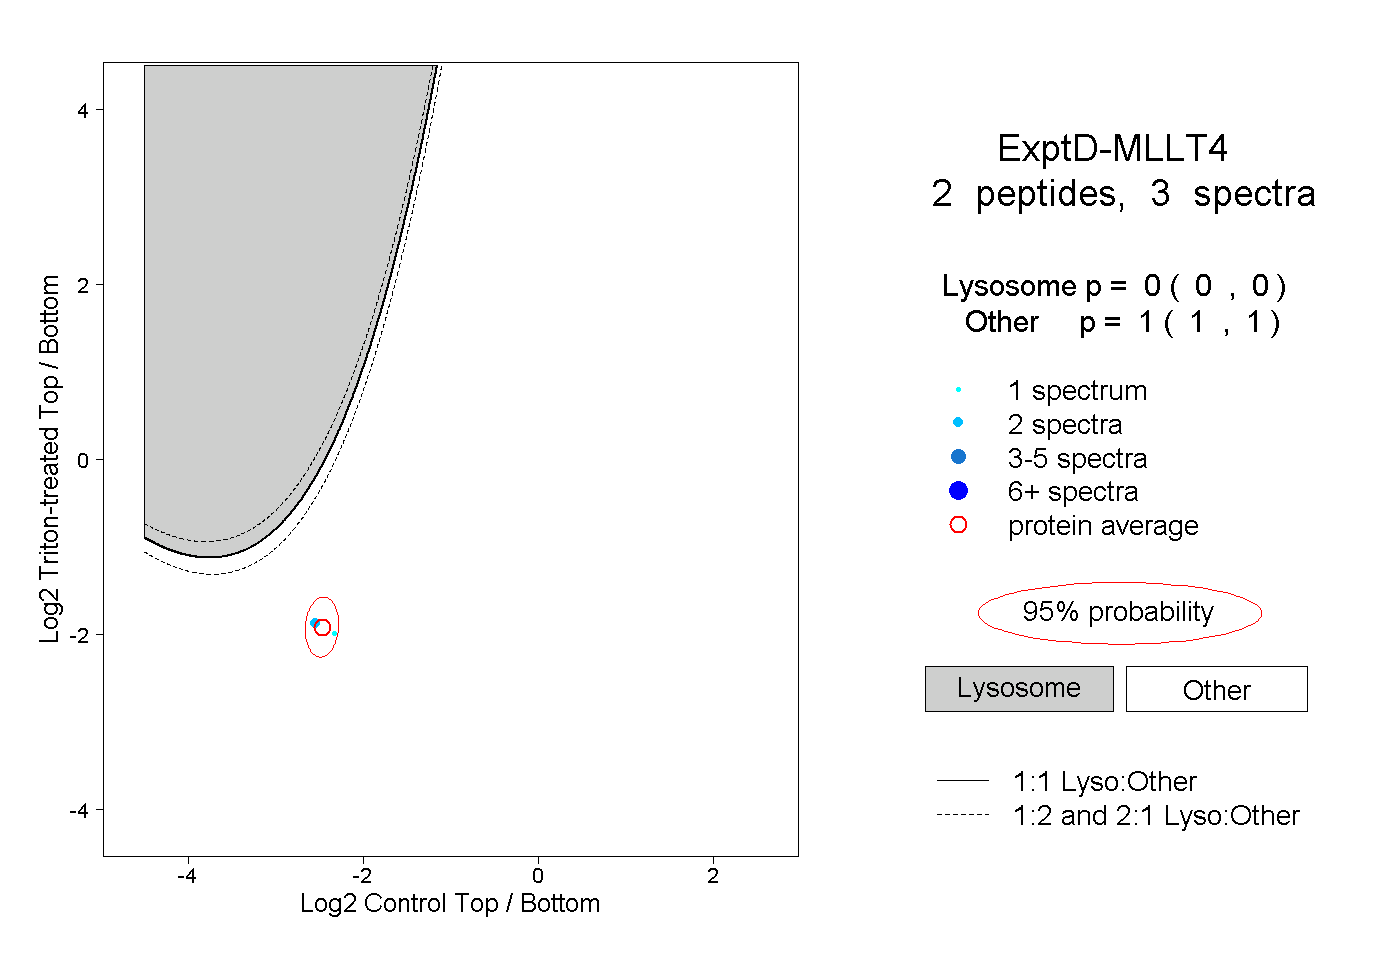
| Expt D |
2
peptides |
3
spectra |
 |
|
0.000
0.000 | 0.000 |
|
|
|
|
|
|
|
1.000
1.000 | 1.000 |