22
22peptides
spectra
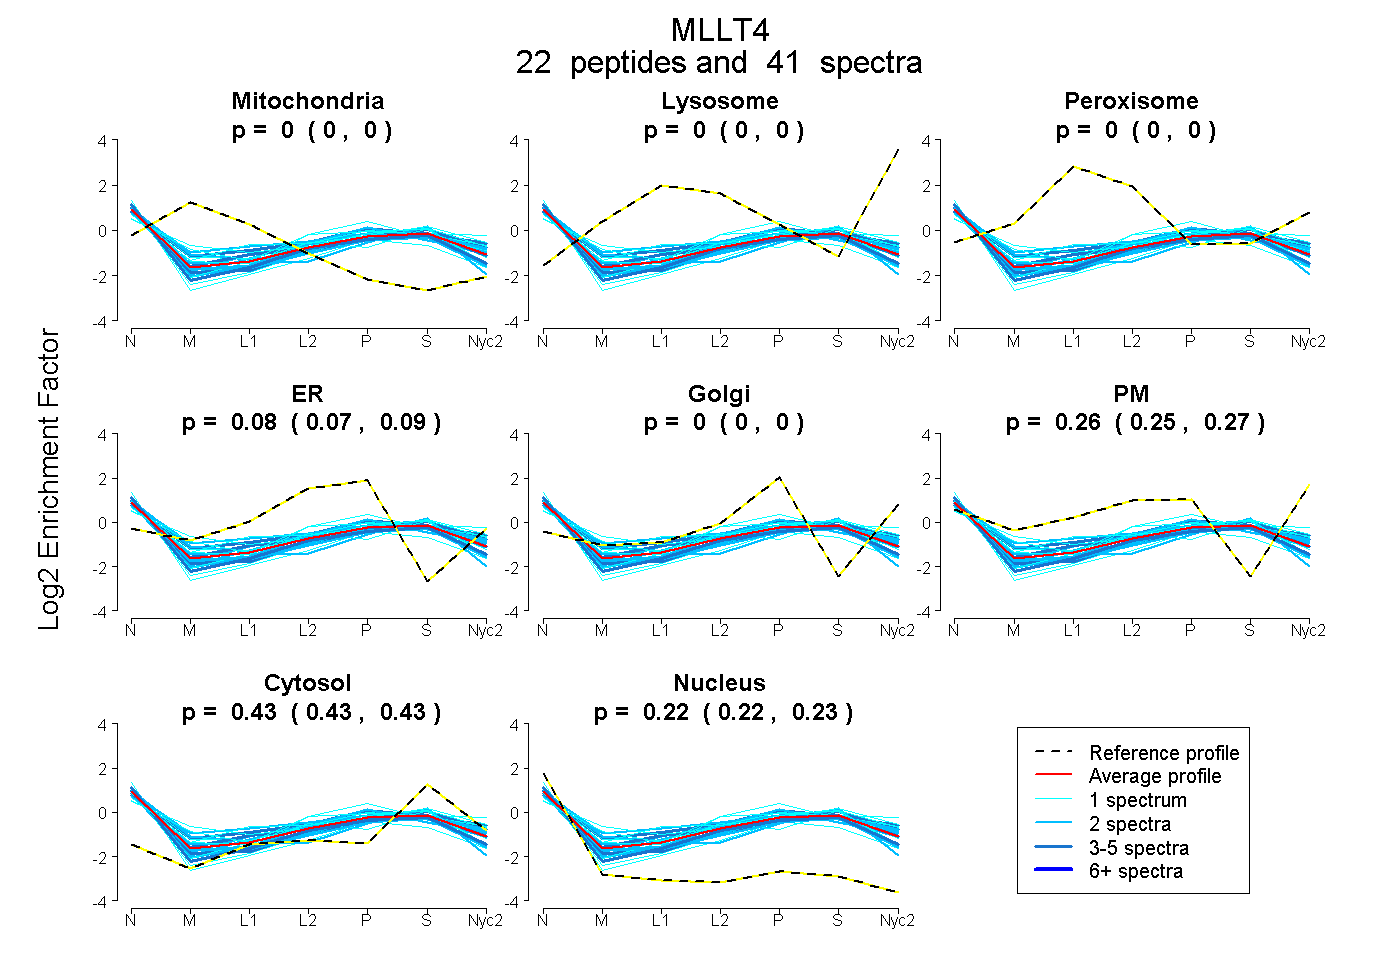
0.000 | 0.000
0.000 | 0.000
0.000 | 0.000
0.074 | 0.092
0.000 | 0.000
0.253 | 0.272
0.427 | 0.433
0.220 | 0.225
4peptides
spectra
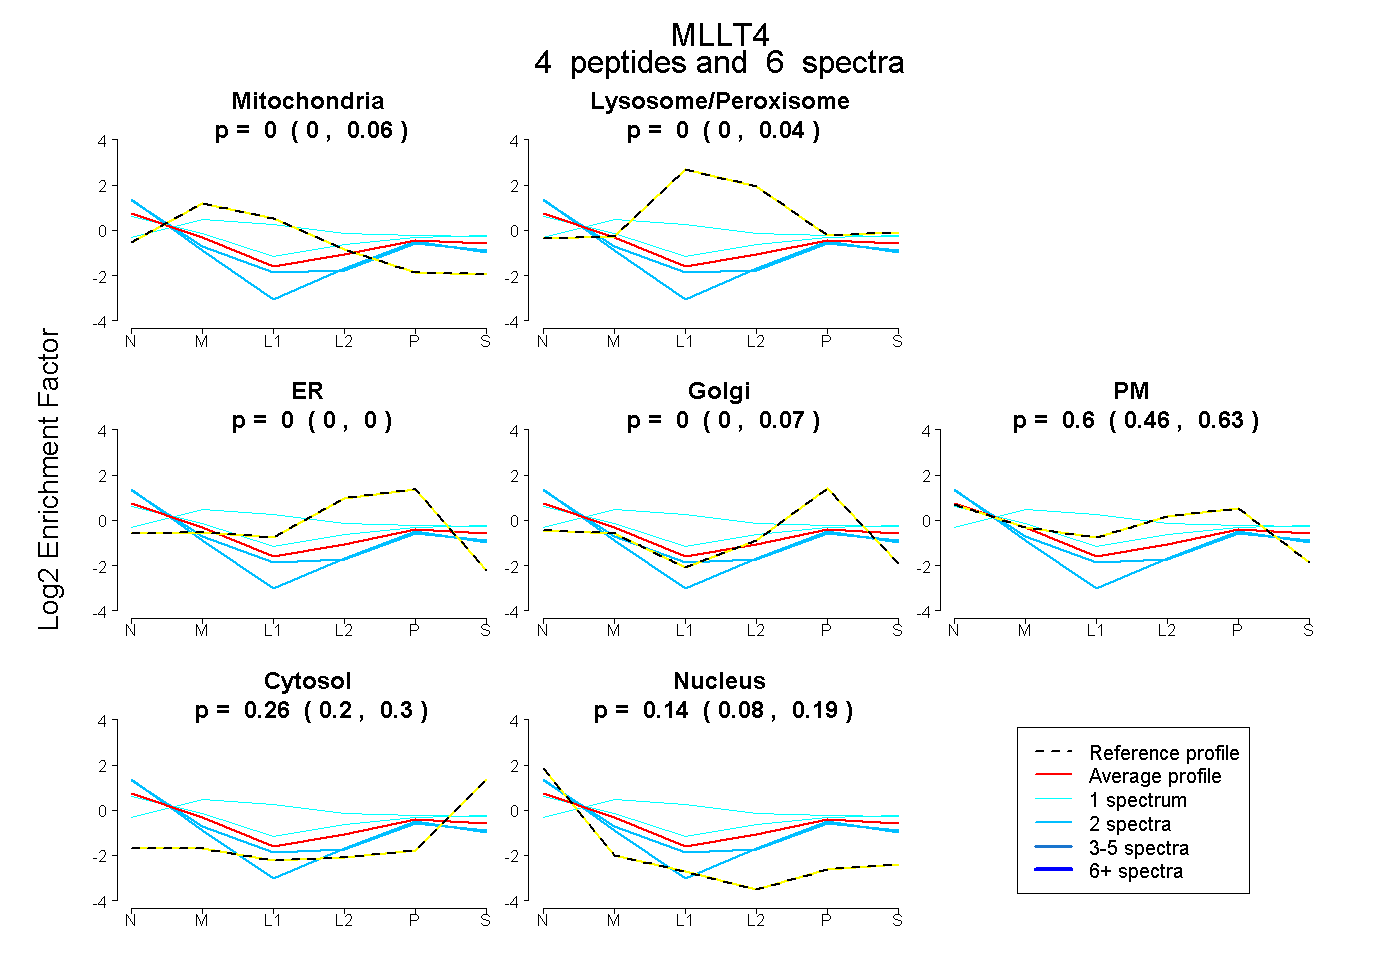
0.000 | 0.063
0.000 | 0.041
0.000 | 0.000
0.000 | 0.071
0.461 | 0.627
0.197 | 0.298
0.084 | 0.191