 22
22peptides
spectra
0.000 | 0.000
0.000 | 0.000
0.000 | 0.000
0.074 | 0.092
0.000 | 0.000
0.253 | 0.272
0.427 | 0.433
0.220 | 0.225
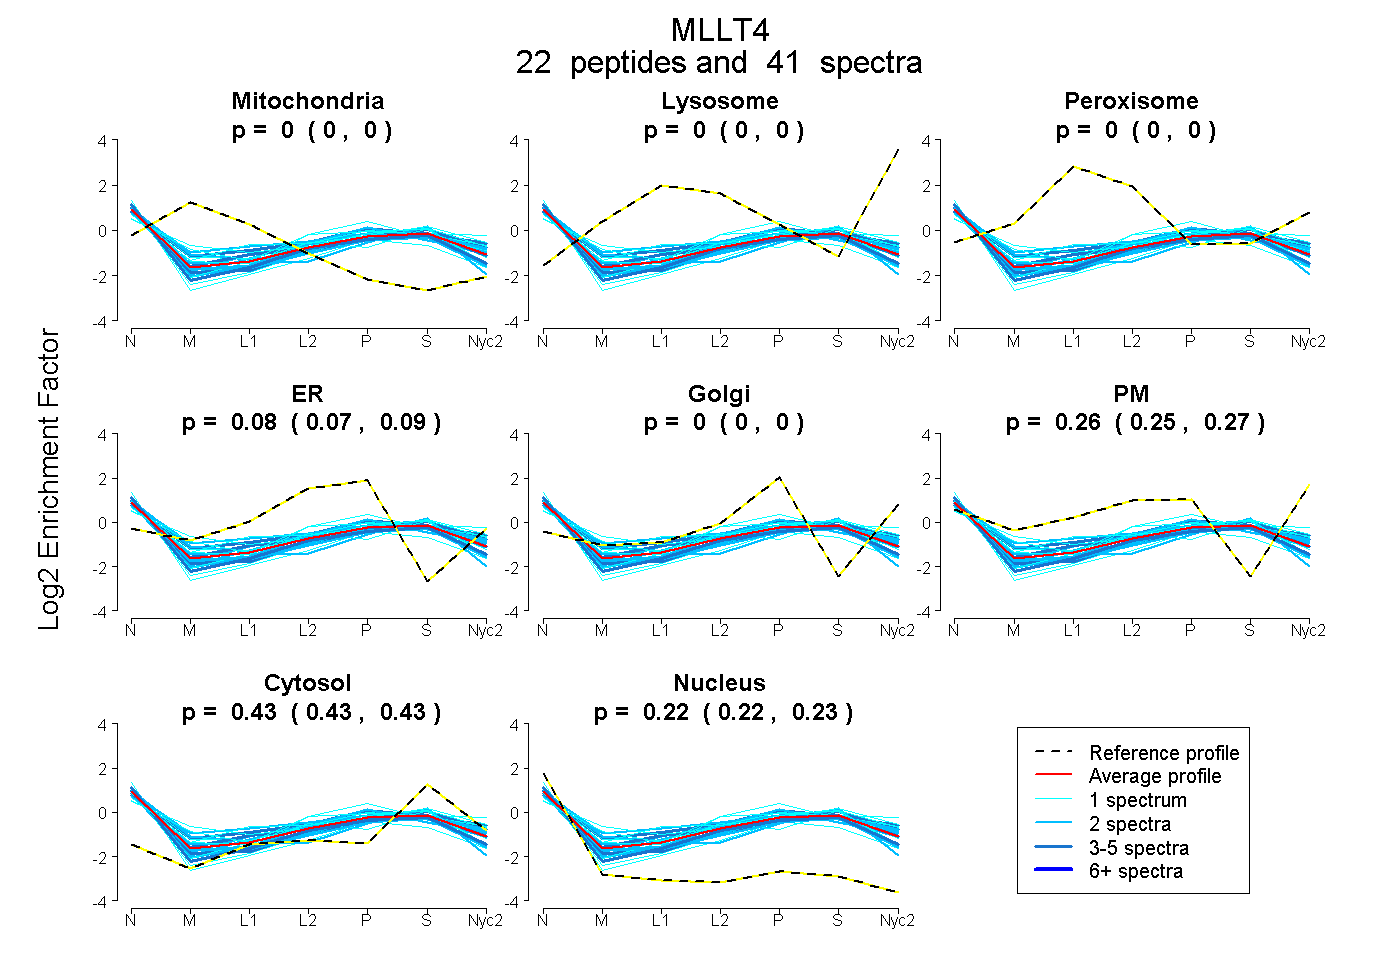
| Plot | Mito | Lyso | Perox | ER | Golgi | PM | Cytosol | Nucleus | |||||
| Expt A |
22 peptides |
41 spectra |
|
0.000 0.000 | 0.000 |
0.000 0.000 | 0.000 |
0.000 0.000 | 0.000 |
0.084 0.074 | 0.092 |
0.000 0.000 | 0.000 |
0.263 0.253 | 0.272 |
0.430 0.427 | 0.433 |
0.223 0.220 | 0.225 |
| 1 spectrum, LVPHTR | 0.061 | 0.000 | 0.035 | 0.337 | 0.000 | 0.000 | 0.431 | 0.136 | ||
| 1 spectrum, GILVFQLK | 0.000 | 0.000 | 0.000 | 0.046 | 0.040 | 0.176 | 0.459 | 0.279 | ||
| 1 spectrum, LQFGTSHVFK | 0.000 | 0.000 | 0.000 | 0.251 | 0.041 | 0.139 | 0.391 | 0.178 | ||
| 2 spectra, LVTDPDSGLCSHYWGAIIR | 0.008 | 0.000 | 0.066 | 0.156 | 0.000 | 0.000 | 0.471 | 0.299 | ||
| 1 spectrum, RPPDYIPK | 0.000 | 0.000 | 0.000 | 0.046 | 0.000 | 0.328 | 0.434 | 0.192 | ||
| 4 spectra, VSSASSTAER | 0.000 | 0.000 | 0.000 | 0.153 | 0.000 | 0.137 | 0.415 | 0.294 | ||
| 3 spectra, ISETTMLQSGMR | 0.000 | 0.000 | 0.030 | 0.000 | 0.000 | 0.327 | 0.462 | 0.180 | ||
| 1 spectrum, VSSTATTQDVIETLAEK | 0.000 | 0.000 | 0.122 | 0.000 | 0.000 | 0.294 | 0.446 | 0.138 | ||
| 1 spectrum, QQLGHIEAWAEK | 0.000 | 0.000 | 0.041 | 0.000 | 0.000 | 0.299 | 0.464 | 0.196 | ||
| 3 spectra, LDQEQDYR | 0.000 | 0.000 | 0.000 | 0.031 | 0.000 | 0.265 | 0.441 | 0.263 | ||
| 2 spectra, GMVKPMIR | 0.000 | 0.000 | 0.154 | 0.076 | 0.000 | 0.247 | 0.304 | 0.219 | ||
| 2 spectra, SLVGLSQER | 0.000 | 0.000 | 0.000 | 0.125 | 0.000 | 0.164 | 0.392 | 0.319 | ||
| 1 spectrum, ELQPQQQPR | 0.000 | 0.000 | 0.000 | 0.098 | 0.071 | 0.096 | 0.335 | 0.401 | ||
| 2 spectra, FVDPIQDHVLSK | 0.000 | 0.000 | 0.000 | 0.104 | 0.000 | 0.242 | 0.487 | 0.166 | ||
| 4 spectra, AAELMTR | 0.000 | 0.000 | 0.035 | 0.057 | 0.000 | 0.363 | 0.400 | 0.146 | ||
| 2 spectra, FRPDMR | 0.000 | 0.000 | 0.000 | 0.166 | 0.000 | 0.260 | 0.357 | 0.217 | ||
| 2 spectra, LAAGDQLLSVDGR | 0.000 | 0.000 | 0.000 | 0.138 | 0.000 | 0.156 | 0.400 | 0.306 | ||
| 1 spectrum, TSSVVTLEVAK | 0.163 | 0.000 | 0.018 | 0.218 | 0.000 | 0.061 | 0.443 | 0.097 | ||
| 2 spectra, SMDAETYVDGQR | 0.000 | 0.000 | 0.000 | 0.000 | 0.000 | 0.349 | 0.427 | 0.224 | ||
| 1 spectrum, IDDVLHTLTGAMSLLR | 0.000 | 0.000 | 0.000 | 0.000 | 0.000 | 0.419 | 0.428 | 0.153 | ||
| 2 spectra, QEEGYYSR | 0.000 | 0.000 | 0.000 | 0.000 | 0.030 | 0.293 | 0.435 | 0.242 | ||
| 2 spectra, AIAVVNK | 0.019 | 0.000 | 0.050 | 0.002 | 0.000 | 0.303 | 0.366 | 0.261 |
| Plot | Mito | Lyso or Perox | ER | Golgi | PM | Cytosol | Nucleus | ||||||
| Expt B |
4 peptides |
6 spectra |
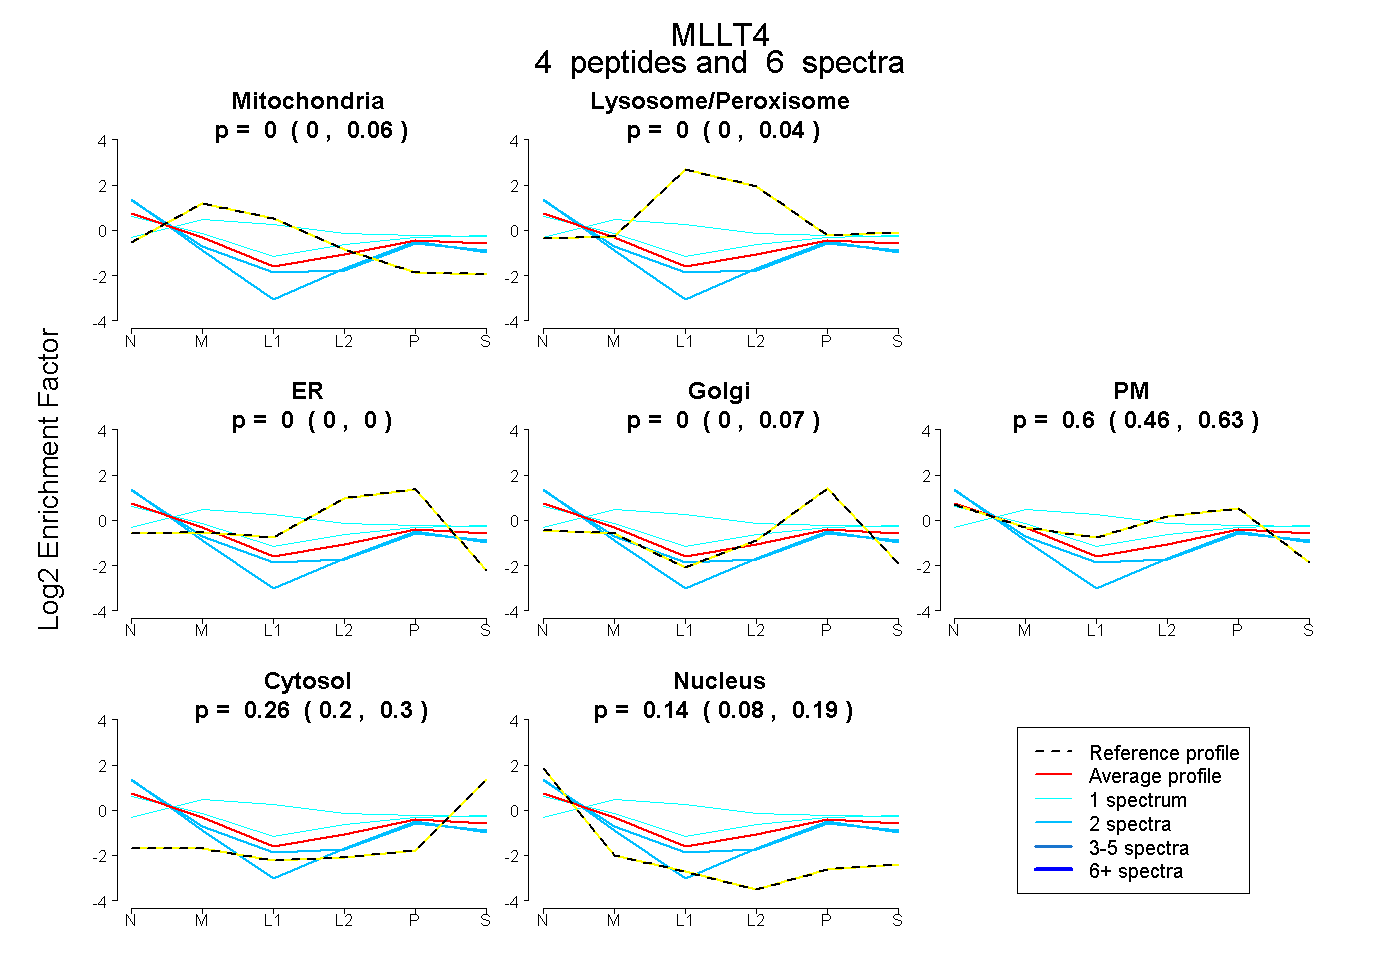 |
0.000 0.000 | 0.063 |
0.000 0.000 | 0.041 |
0.000 0.000 | 0.000 |
0.000 0.000 | 0.071 |
0.599 0.461 | 0.627 |
0.261 0.197 | 0.298 |
0.139 0.084 | 0.191 |
|||
| Plot | Lyso | Other | |||||||||||
| Expt C |
16 peptides |
41 spectra |
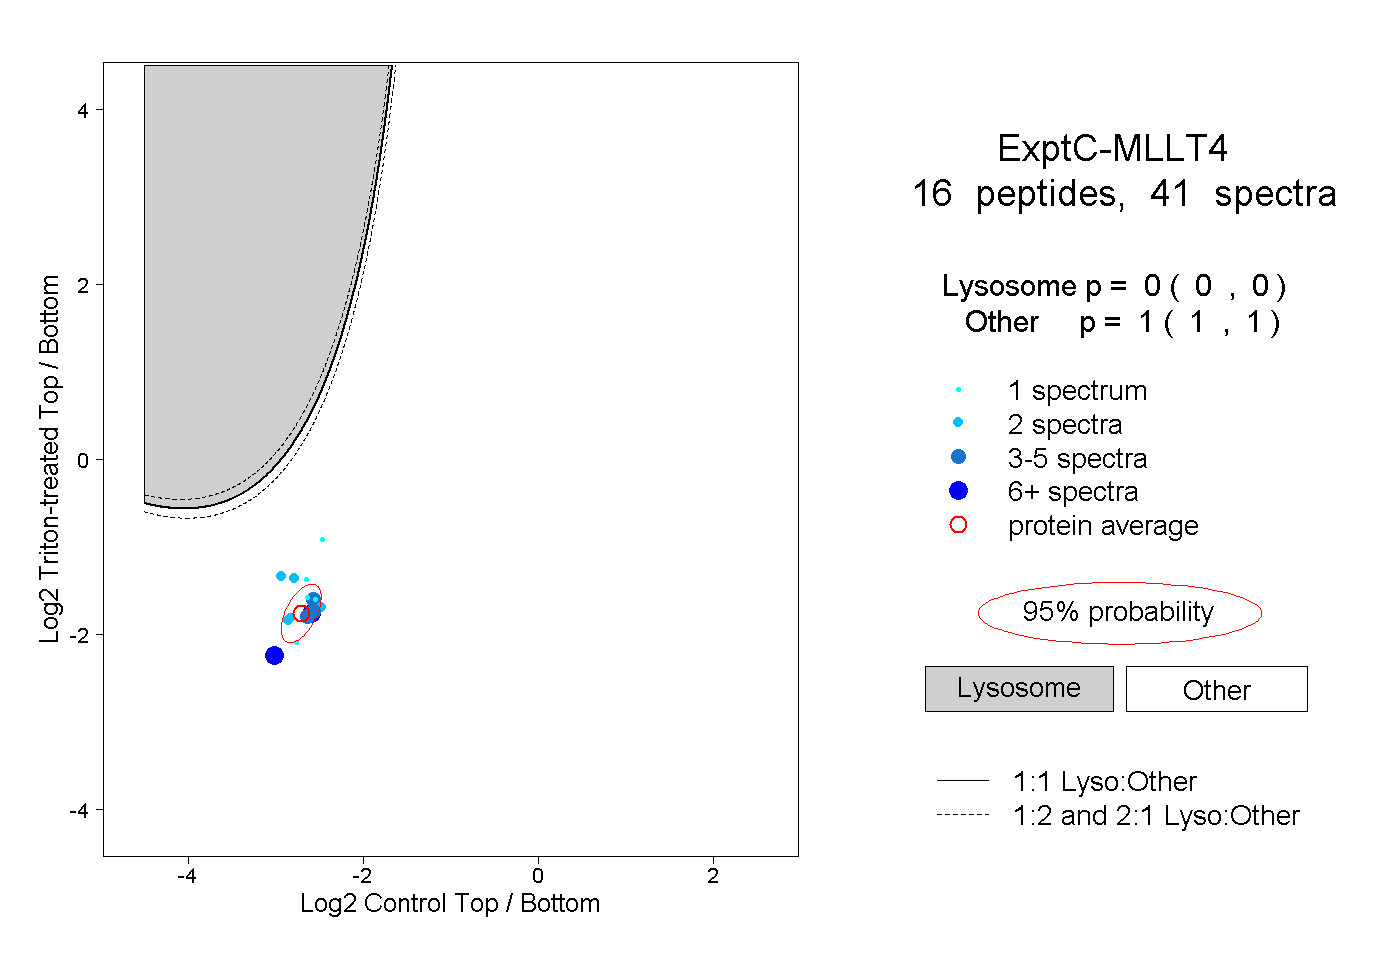 |
0.000 0.000 | 0.000 |
1.000 1.000 | 1.000 |
||||||||
| Plot | Lyso | Other | |||||||||||
| Expt D |
2 peptides |
3 spectra |
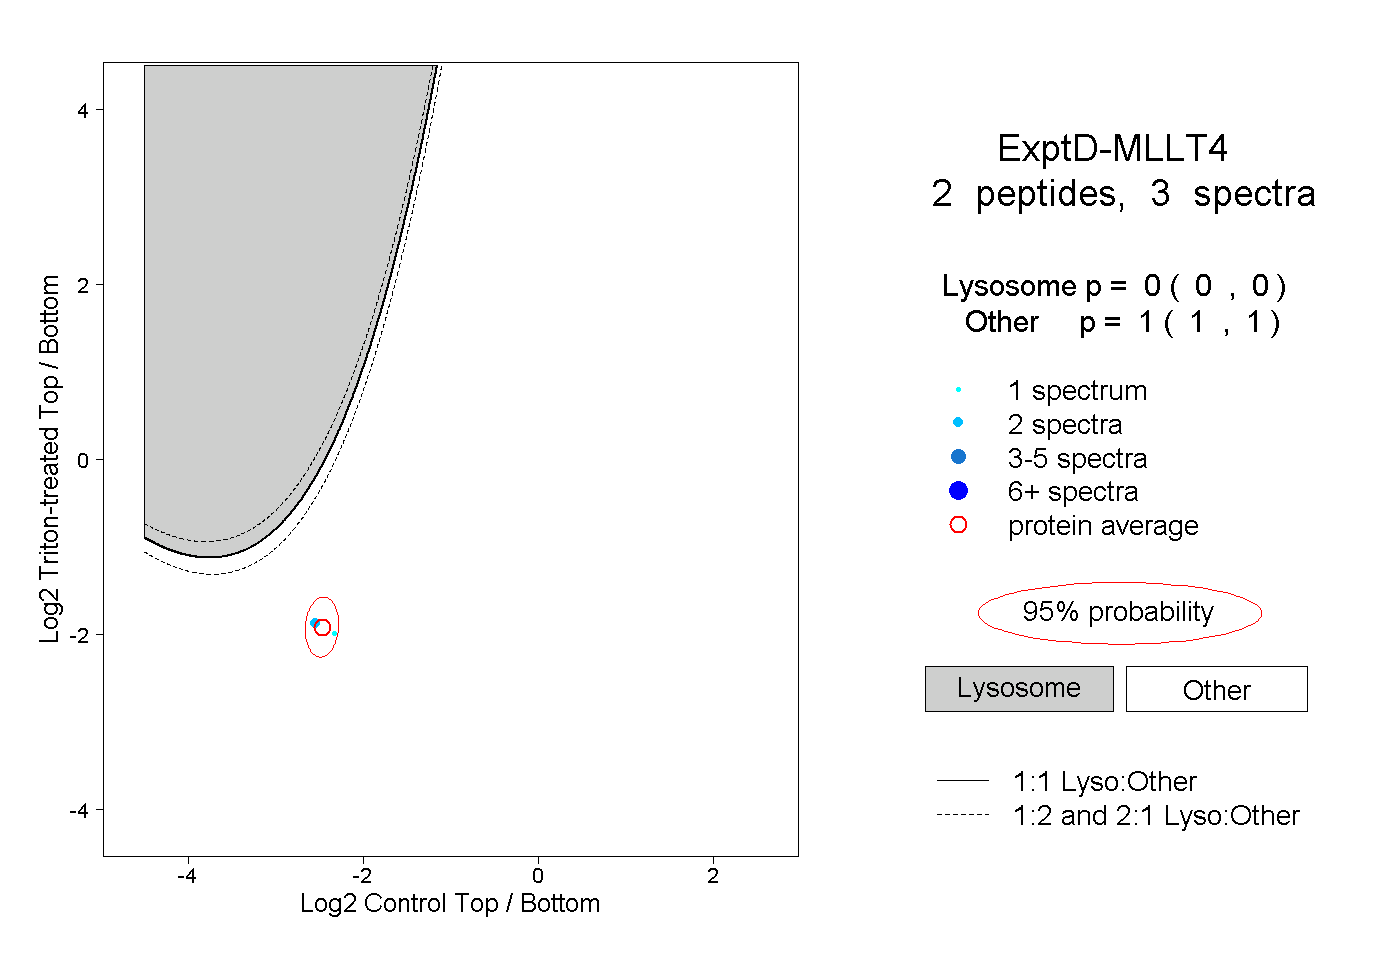 |
0.000 0.000 | 0.000 |
1.000 1.000 | 1.000 |