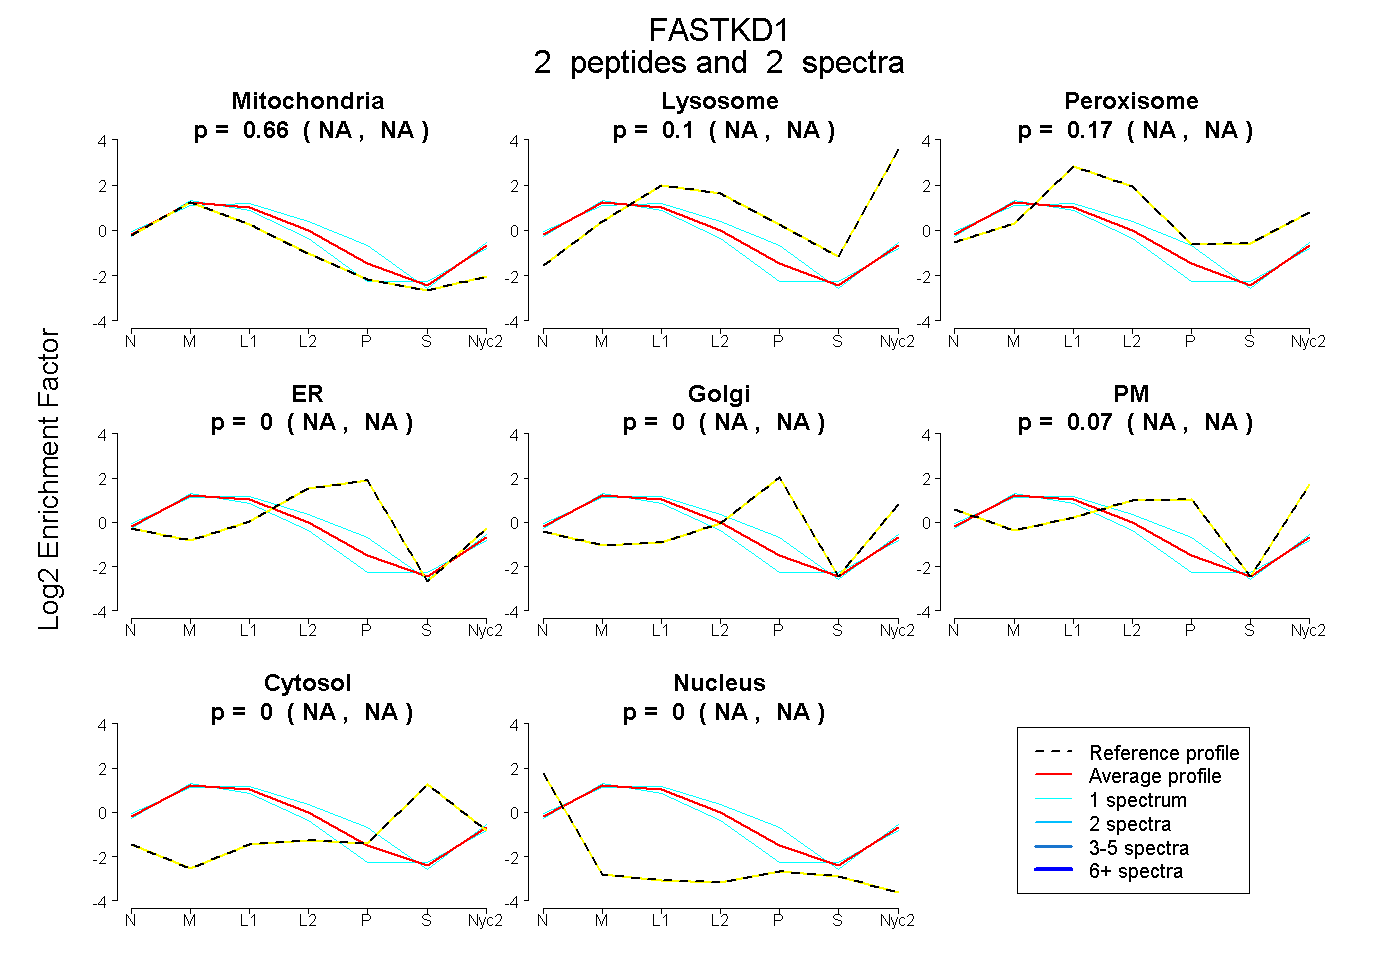
 2
2peptides
spectra
NA | NA
NA | NA
NA | NA
NA | NA
NA | NA
NA | NA
NA | NA
NA | NA
| Plot | Mito | Lyso | Perox | ER | Golgi | PM | Cytosol | Nucleus | |||||
| Expt A |
2 peptides |
2 spectra |
|
0.662 NA | NA |
0.098 NA | NA |
0.171 NA | NA |
0.000 NA | NA |
0.000 NA | NA |
0.070 NA | NA |
0.000 NA | NA |
0.000 NA | NA |
| 1 spectrum, LIFLLR | 0.503 | 0.012 | 0.233 | 0.073 | 0.000 | 0.179 | 0.000 | 0.000 | ||
| 1 spectrum, AELLFDTVDSSK | 0.775 | 0.120 | 0.106 | 0.000 | 0.000 | 0.000 | 0.000 | 0.000 |
| Plot | Lyso | Other | |||||||||||
| Expt C |
8 peptides |
10 spectra |
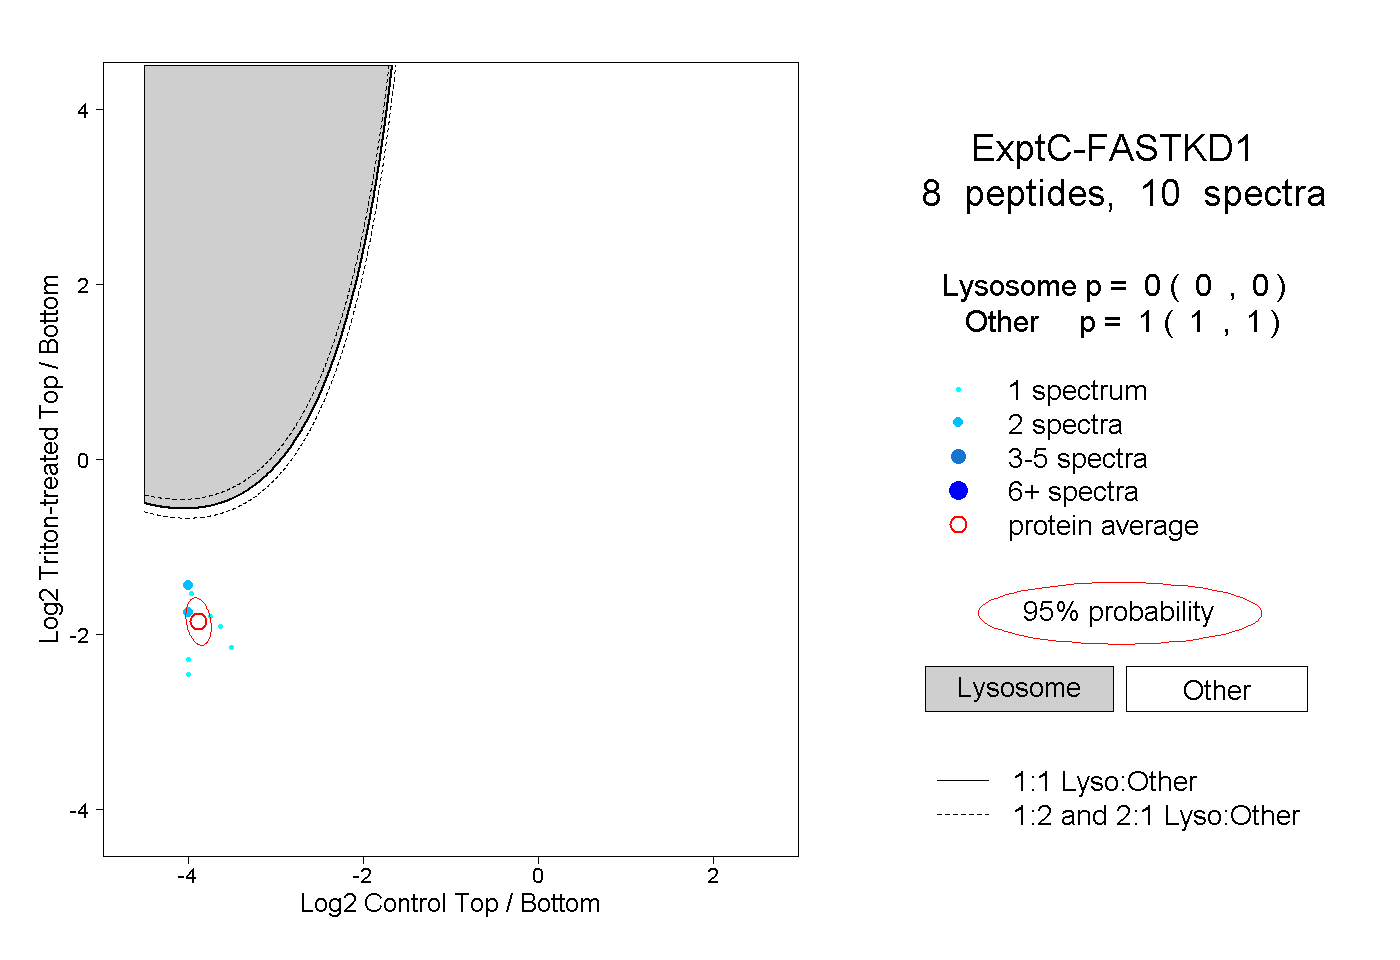 |
0.000 0.000 | 0.000 |
1.000 1.000 | 1.000 |
||||||||
| Plot | Lyso | Other | |||||||||||
| Expt D |
2 peptides |
4 spectra |
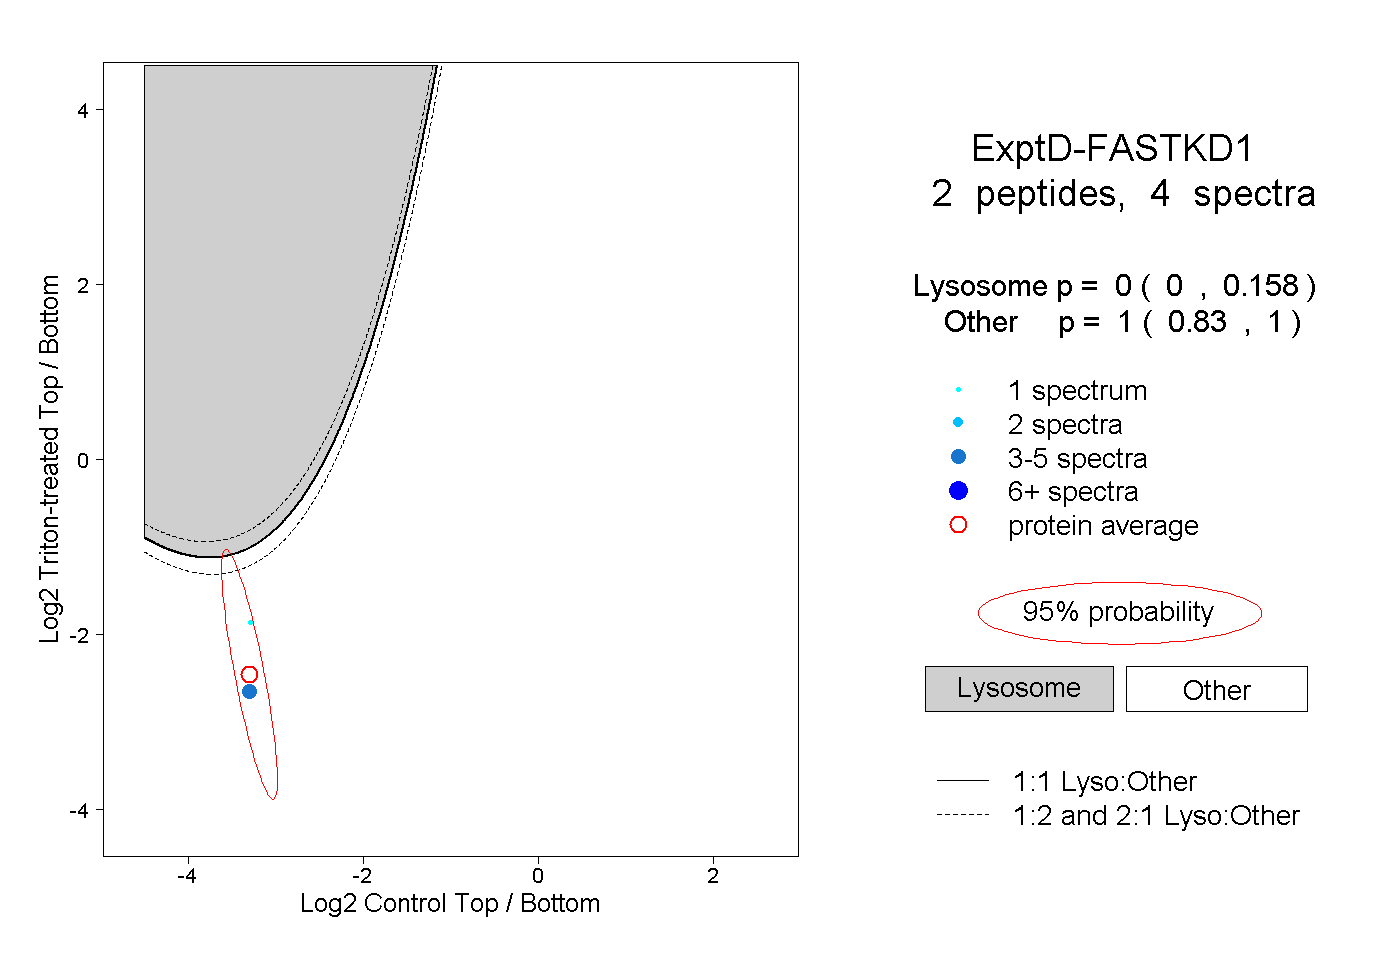 |
0.000 0.000 | 0.158 |
1.000 0.830 | 1.000 |