 3
3peptides
spectra
0.544 | 0.822
0.000 | 0.137
0.000 | 0.167
0.000 | 0.284
0.000 | 0.000
0.000 | 0.212
0.000 | 0.000
0.000 | 0.000
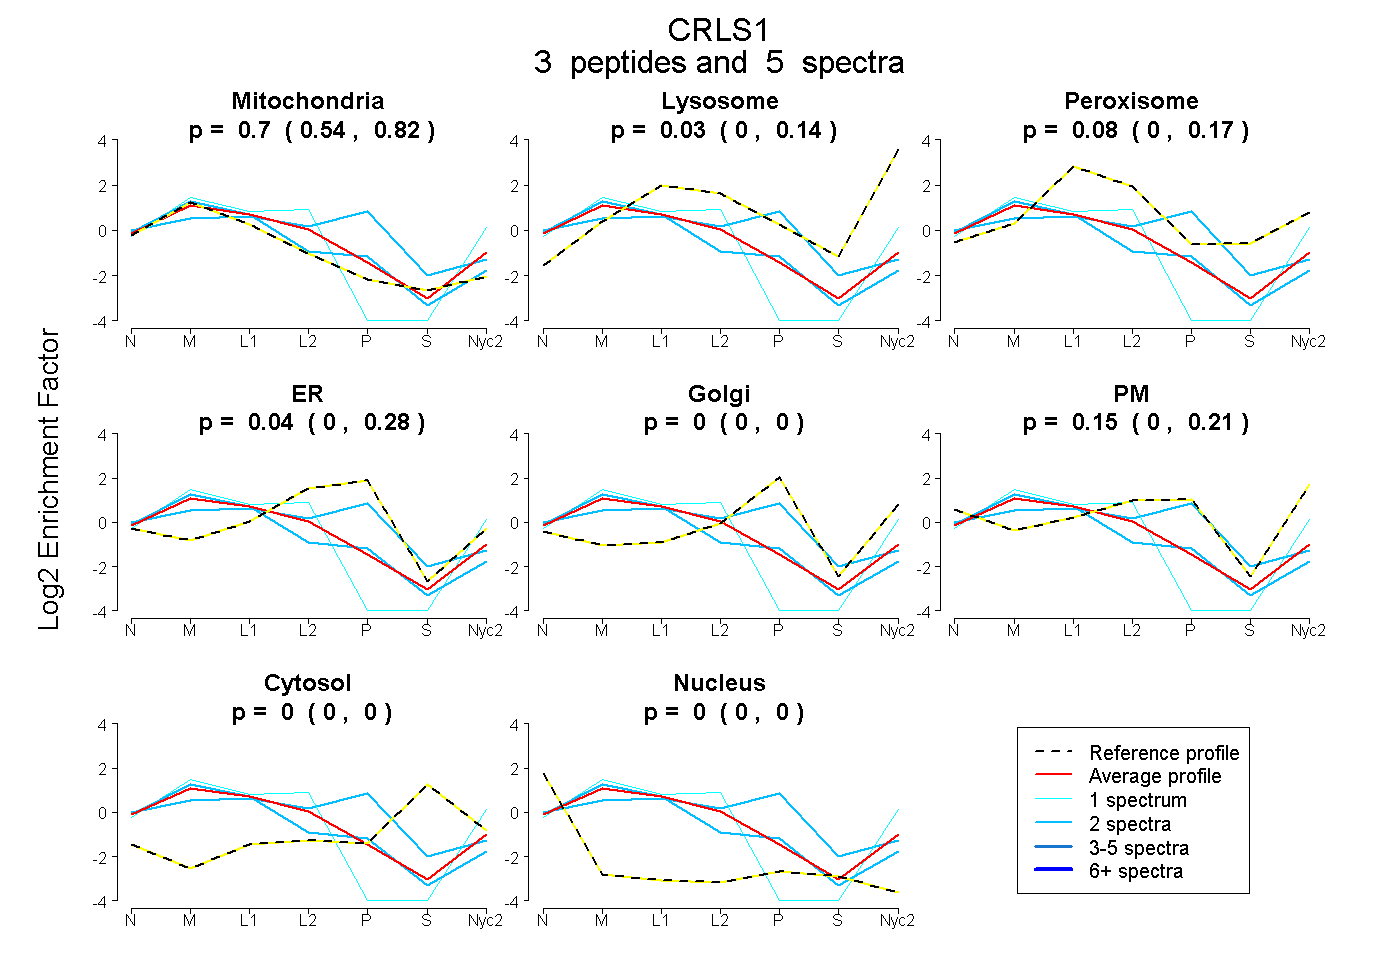
| Plot | Mito | Lyso | Perox | ER | Golgi | PM | Cytosol | Nucleus | |||||
| Expt A |
3 peptides |
5 spectra |
|
0.701 0.544 | 0.822 |
0.027 0.000 | 0.137 |
0.081 0.000 | 0.167 |
0.038 0.000 | 0.284 |
0.000 0.000 | 0.000 |
0.153 0.000 | 0.212 |
0.000 0.000 | 0.000 |
0.000 0.000 | 0.000 |
| 2 spectra, YFNPCYATAR | 0.846 | 0.000 | 0.000 | 0.151 | 0.000 | 0.003 | 0.000 | 0.000 | ||
| 1 spectrum, NWANQK | 0.779 | 0.221 | 0.000 | 0.000 | 0.000 | 0.000 | 0.000 | 0.000 | ||
| 2 spectra, LRPAAFALR | 0.381 | 0.000 | 0.074 | 0.538 | 0.007 | 0.000 | 0.000 | 0.000 |
| Plot | Lyso | Other | |||||||||||
| Expt C |
6 peptides |
24 spectra |
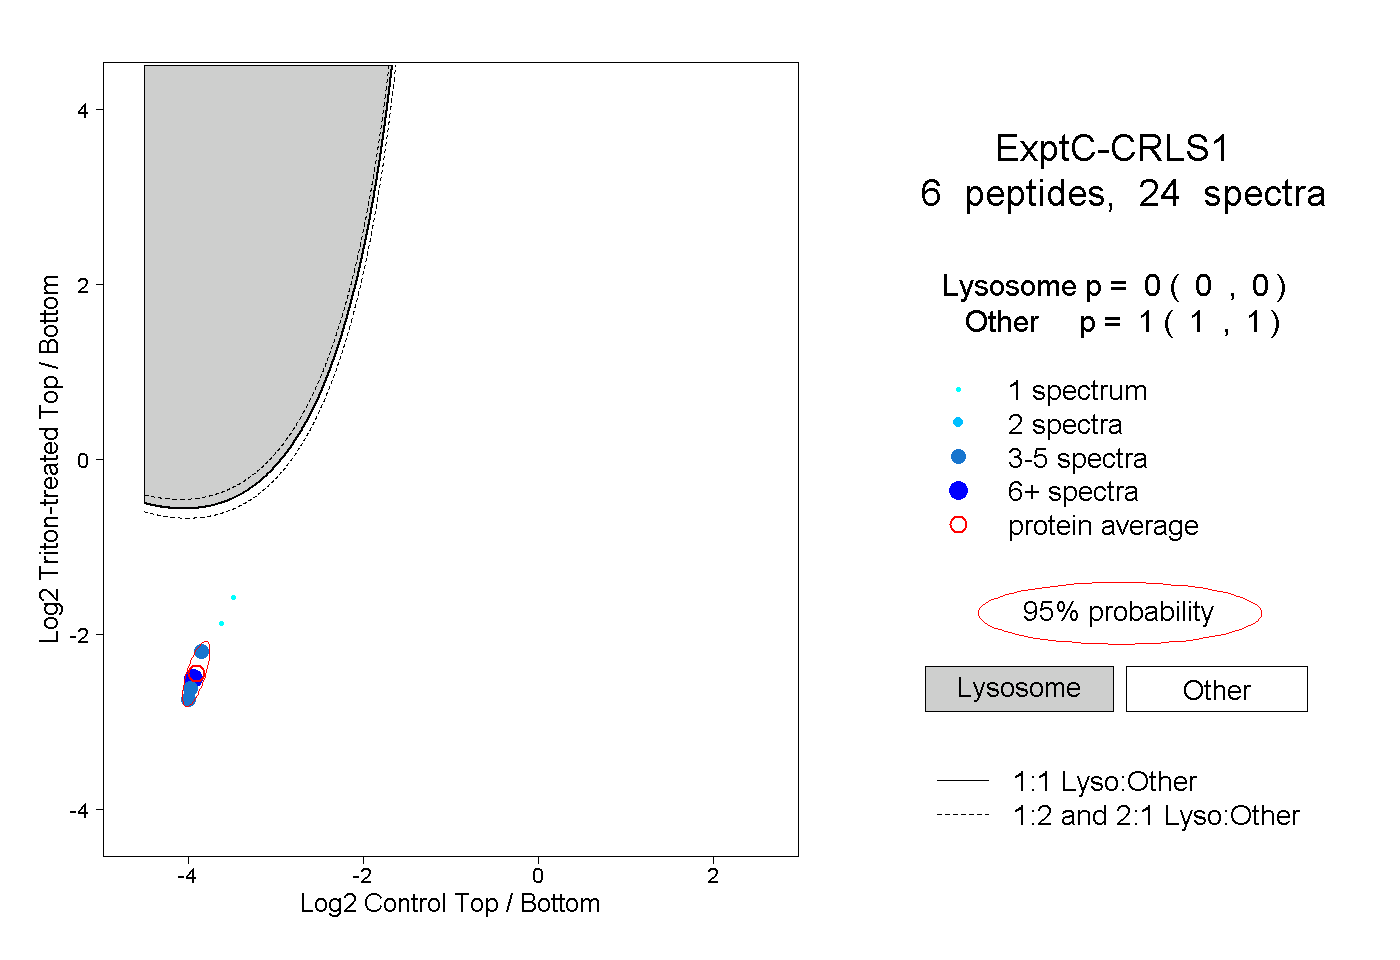 |
0.000 0.000 | 0.000 |
1.000 1.000 | 1.000 |
||||||||
| Plot | Lyso | Other | |||||||||||
| Expt D |
2 peptides |
2 spectra |
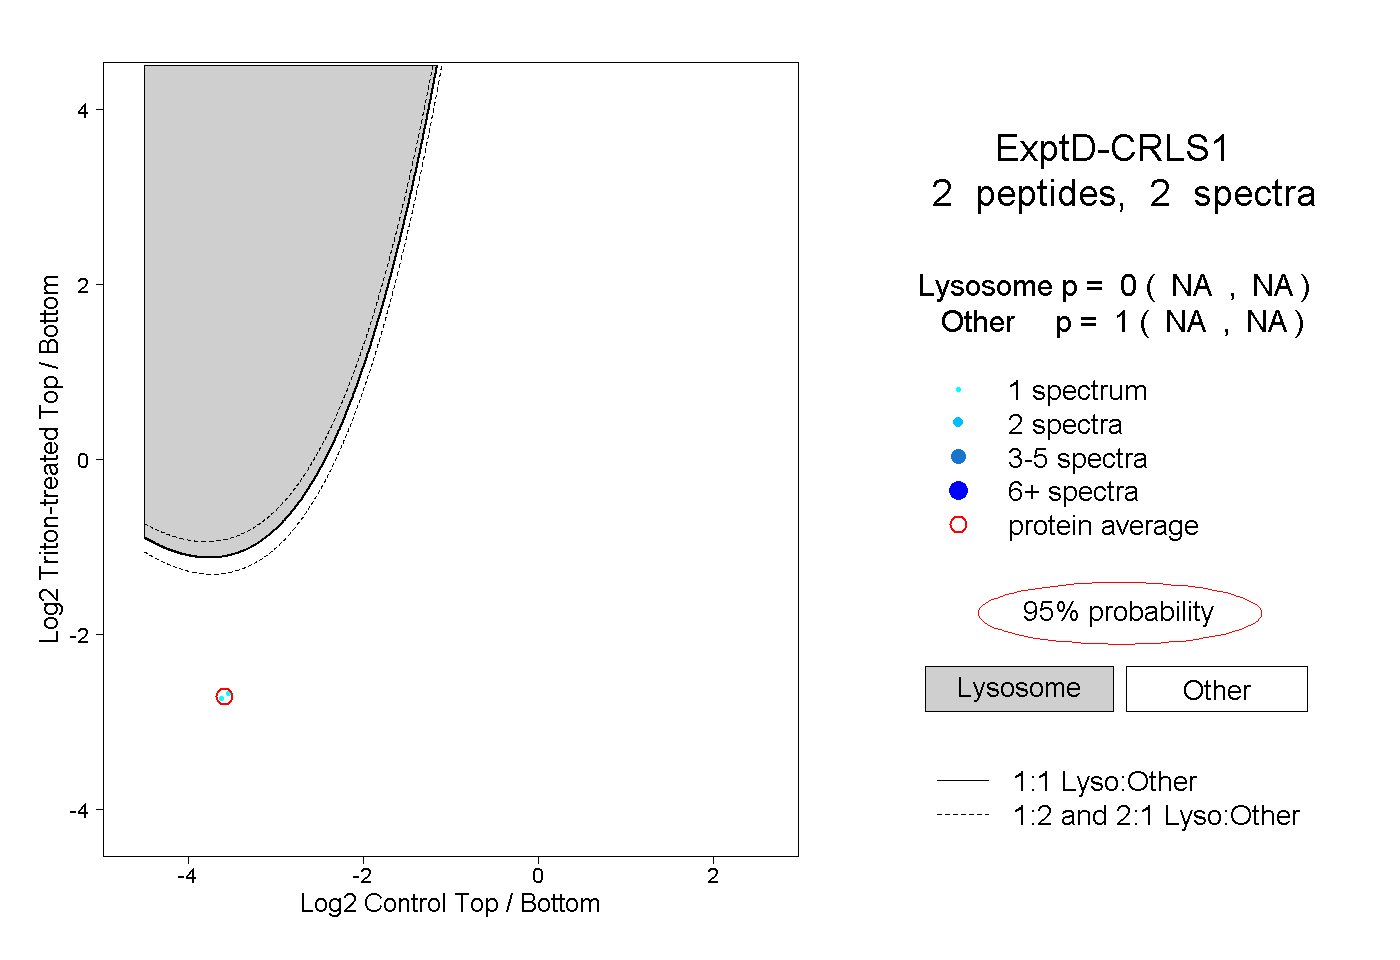 |
0.000 NA | NA |
1.000 NA | NA |