 3
3peptides
spectra
0.074 | 0.144
0.000 | 0.129
0.000 | 0.139
0.000 | 0.000
0.000 | 0.000
0.000 | 0.000
0.720 | 0.783
0.000 | 0.000
| Plot | Mito | Lyso | Perox | ER | Golgi | PM | Cytosol | Nucleus | |||||
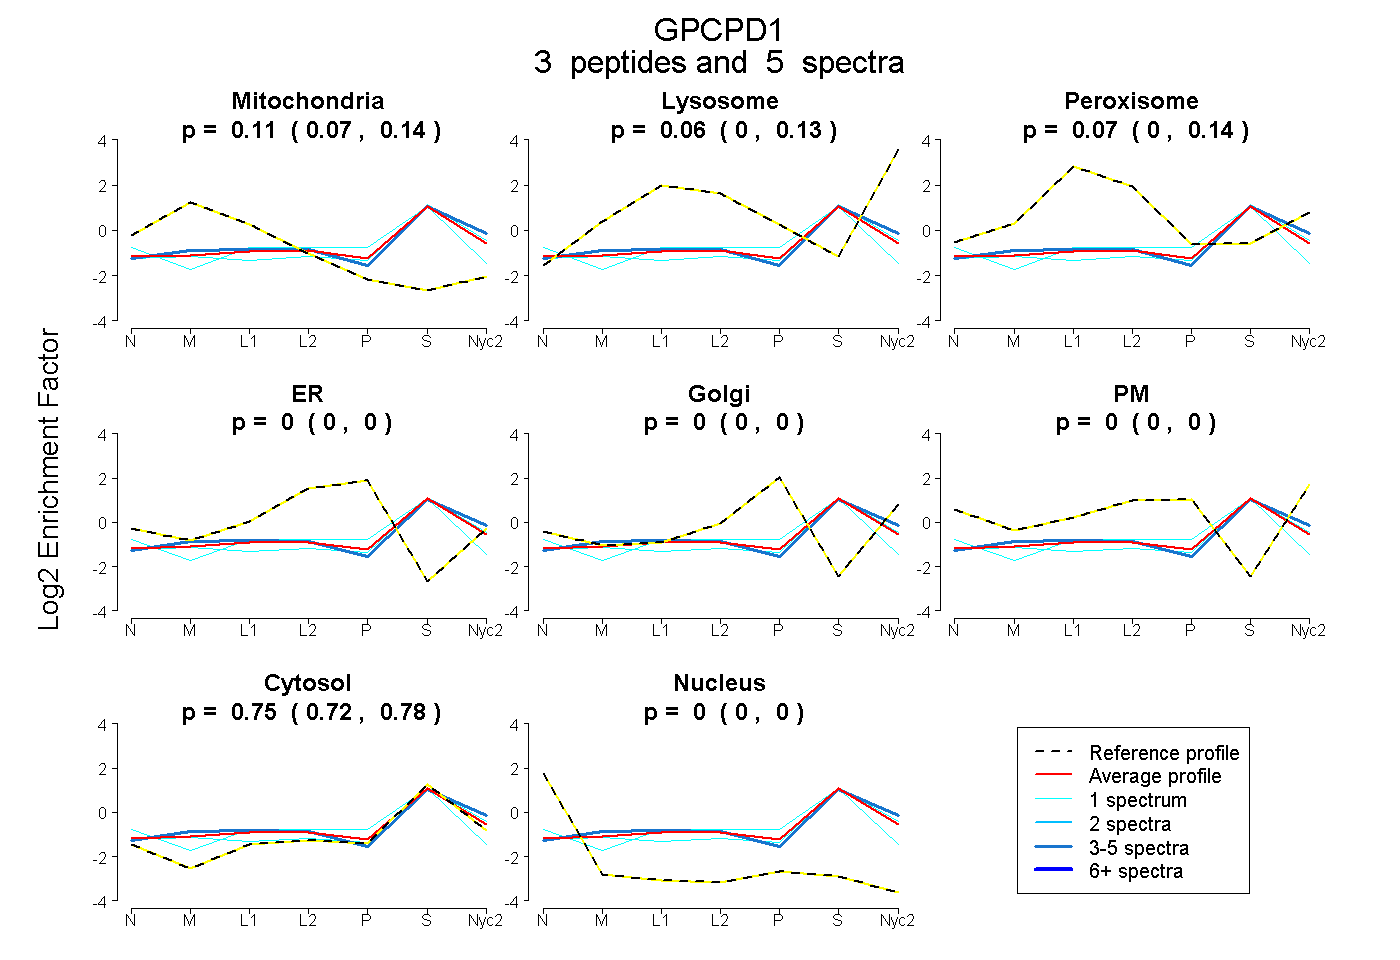
| Expt A |
3 peptides |
5 spectra |
|
0.112 0.074 | 0.144 |
0.059 0.000 | 0.129 |
0.075 0.000 | 0.139 |
0.000 0.000 | 0.000 |
0.000 0.000 | 0.000 |
0.000 0.000 | 0.000 |
0.754 0.720 | 0.783 |
0.000 0.000 | 0.000 |
| 3 spectra, YPILFLTQGK | 0.125 | 0.156 | 0.004 | 0.000 | 0.000 | 0.000 | 0.715 | 0.000 | ||
| 1 spectrum, SAGILTLPIMSR | 0.112 | 0.082 | 0.000 | 0.000 | 0.000 | 0.000 | 0.806 | 0.000 | ||
| 1 spectrum, TIGGPCQVIVHK | 0.061 | 0.000 | 0.079 | 0.073 | 0.000 | 0.000 | 0.773 | 0.014 |
| Plot | Lyso | Other | |||||||||||
| Expt C |
2 peptides |
2 spectra |
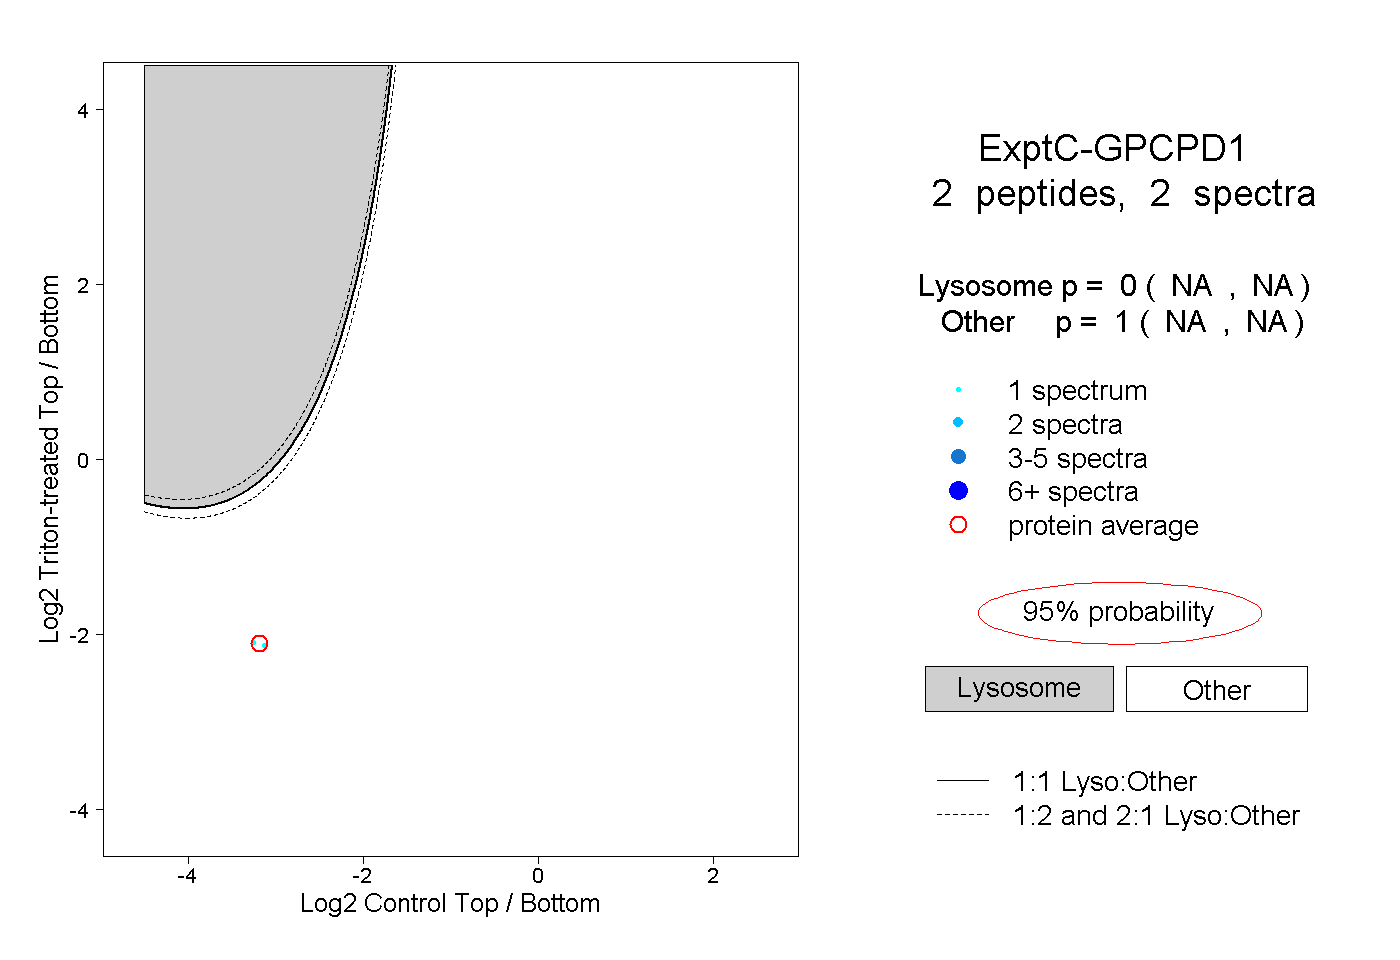 |
0.000 NA | NA |
1.000 NA | NA |