 9
9peptides
spectra
0.000 | 0.000
0.000 | 0.000
0.000 | 0.000
0.000 | 0.000
0.000 | 0.000
0.000 | 0.000
0.876 | 0.894
0.104 | 0.122
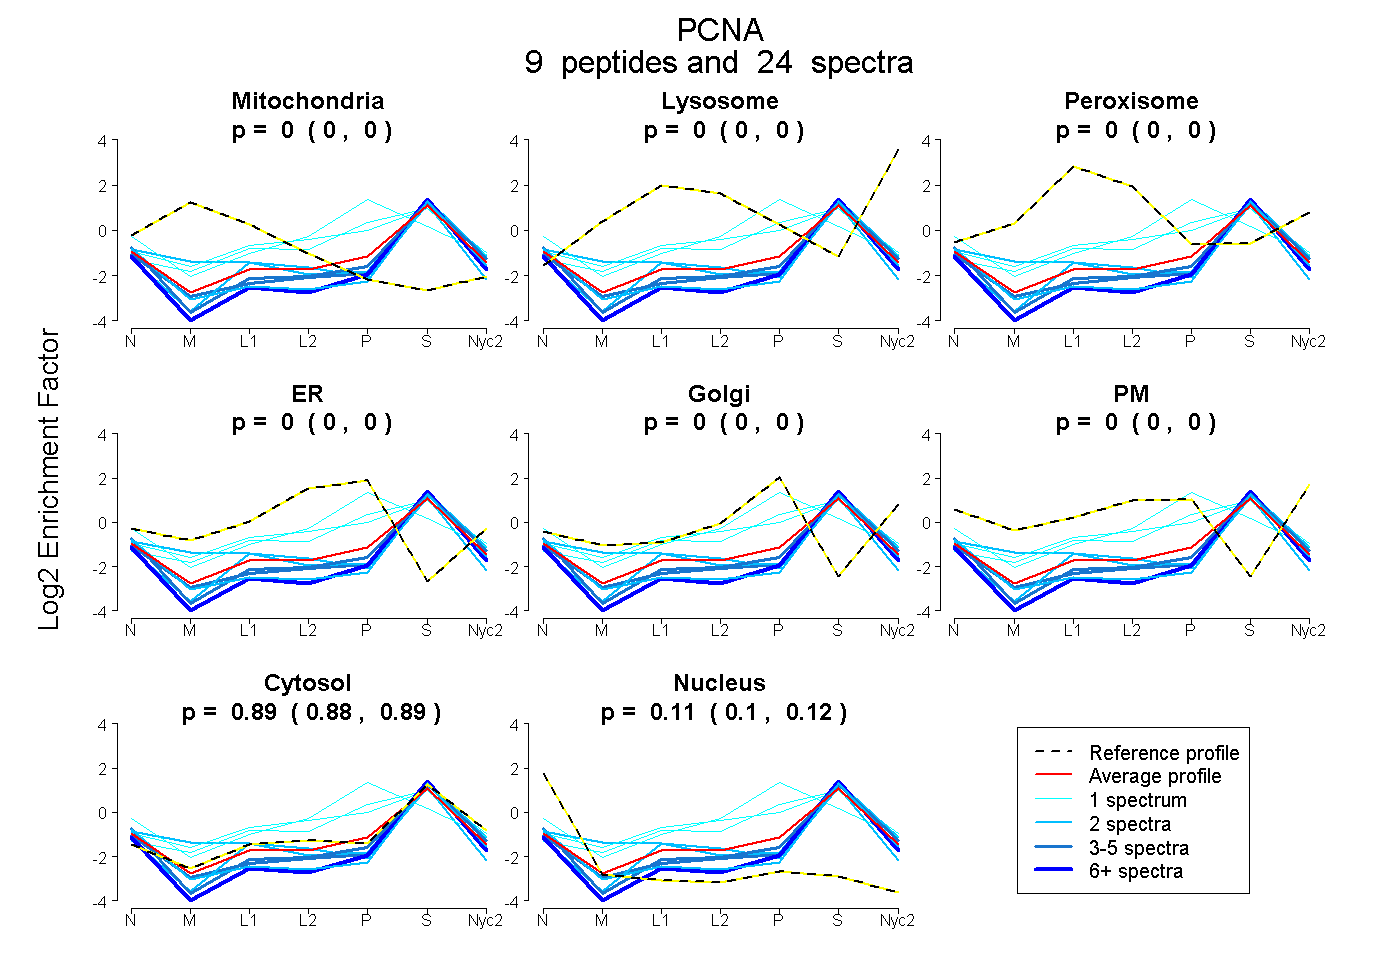
| Plot | Mito | Lyso | Perox | ER | Golgi | PM | Cytosol | Nucleus | |||||
| Expt A |
9 peptides |
24 spectra |
|
0.000 0.000 | 0.000 |
0.000 0.000 | 0.000 |
0.000 0.000 | 0.000 |
0.000 0.000 | 0.000 |
0.000 0.000 | 0.000 |
0.000 0.000 | 0.000 |
0.886 0.876 | 0.894 |
0.114 0.104 | 0.122 |
| 6 spectra, SEGFDTYR | 0.000 | 0.000 | 0.000 | 0.000 | 0.000 | 0.000 | 0.801 | 0.199 | ||
| 2 spectra, YLNFFTK | 0.000 | 0.000 | 0.000 | 0.000 | 0.000 | 0.000 | 0.785 | 0.215 | ||
| 1 spectrum, NLAMGVNLTSMSK | 0.000 | 0.000 | 0.000 | 0.355 | 0.126 | 0.000 | 0.519 | 0.000 | ||
| 5 spectra, VSDYEMK | 0.000 | 0.000 | 0.000 | 0.000 | 0.000 | 0.000 | 0.848 | 0.152 | ||
| 1 spectrum, FSASGELGNGNIK | 0.000 | 0.000 | 0.057 | 0.229 | 0.000 | 0.000 | 0.713 | 0.000 | ||
| 1 spectrum, DLSHIGDAVVISCAK | 0.000 | 0.000 | 0.000 | 0.213 | 0.044 | 0.000 | 0.743 | 0.000 | ||
| 4 spectra, IADMGHLK | 0.000 | 0.000 | 0.000 | 0.000 | 0.000 | 0.000 | 0.860 | 0.140 | ||
| 2 spectra, CAGNEDIITLR | 0.161 | 0.000 | 0.000 | 0.000 | 0.000 | 0.000 | 0.744 | 0.095 | ||
| 2 spectra, MPSGEFAR | 0.000 | 0.000 | 0.000 | 0.000 | 0.000 | 0.000 | 0.926 | 0.074 |
| Plot | Mito | Lyso or Perox | ER | Golgi | PM | Cytosol | Nucleus | ||||||
| Expt B |
1 peptide |
2 spectra |
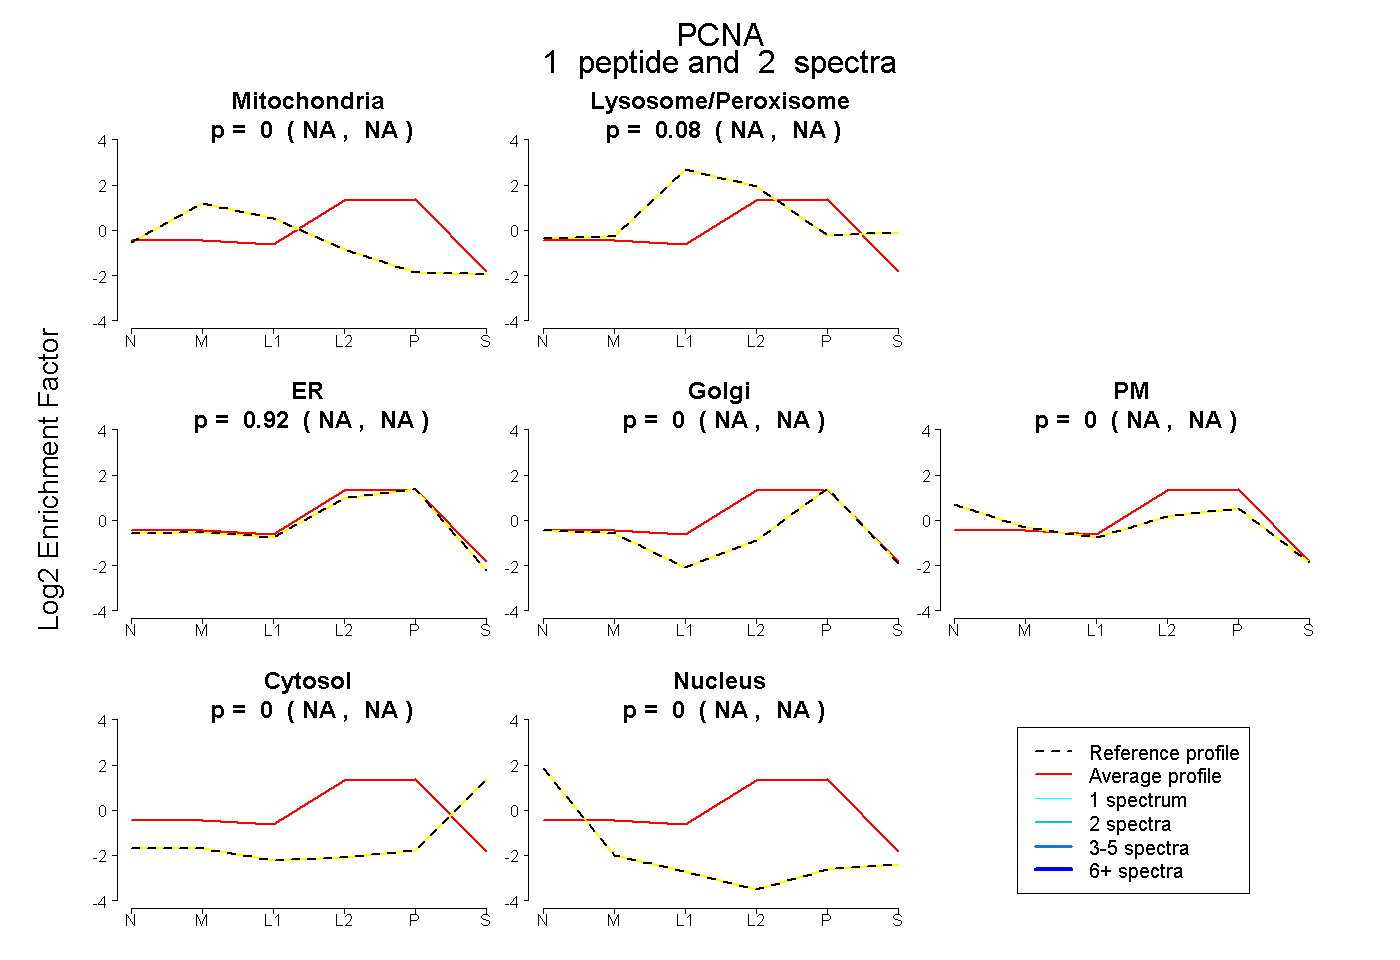 |
0.000 NA | NA |
0.085 NA | NA |
0.915 NA | NA |
0.000 NA | NA |
0.000 NA | NA |
0.000 NA | NA |
0.000 NA | NA |
|||
| Plot | Lyso | Other | |||||||||||
| Expt C |
3 peptides |
4 spectra |
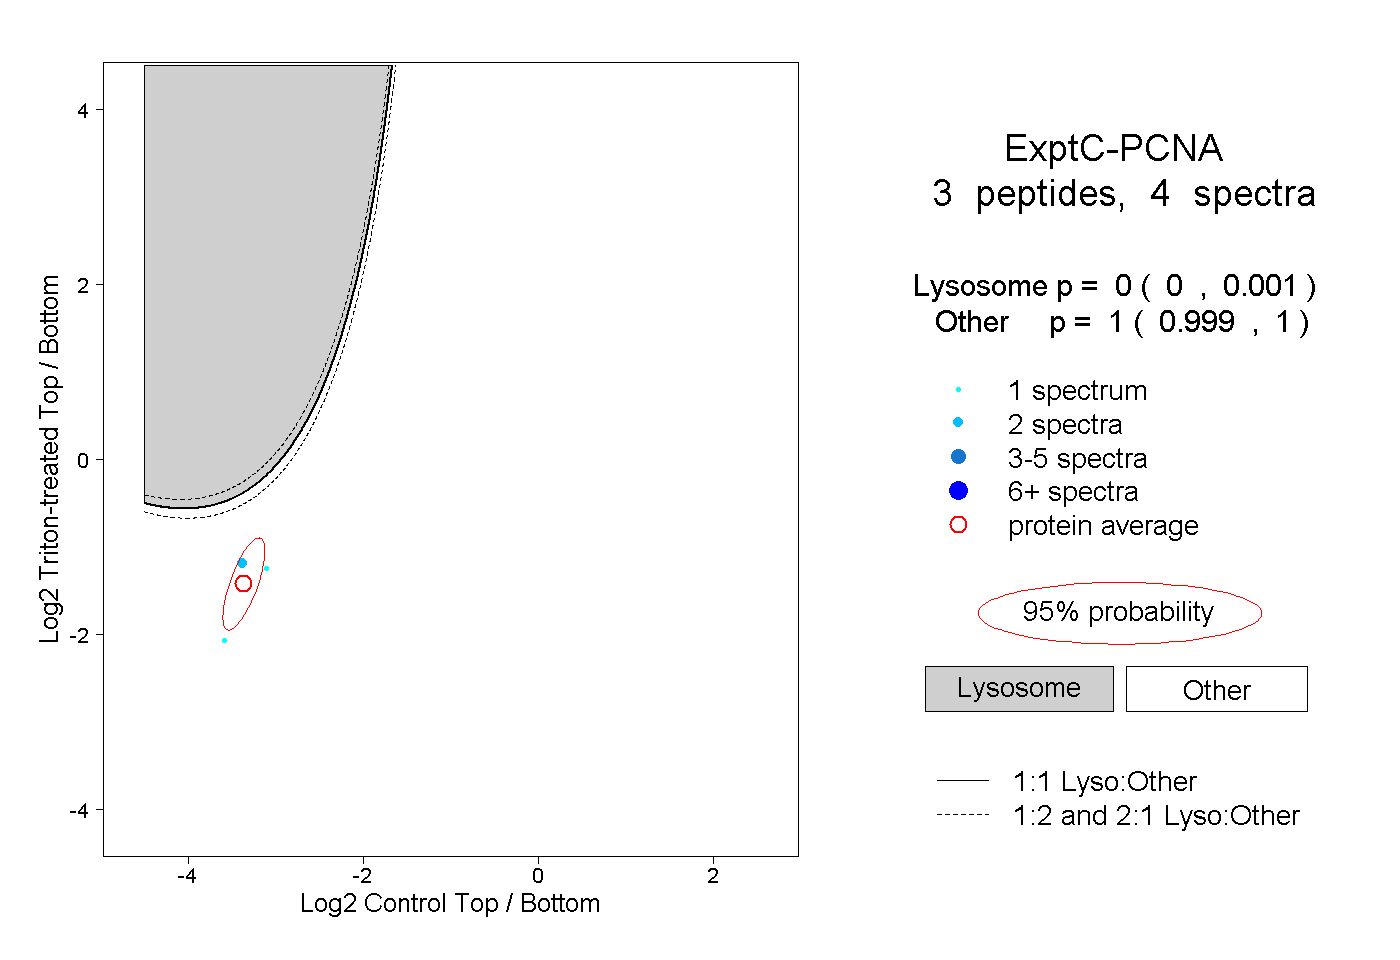 |
0.000 0.000 | 0.001 |
1.000 0.999 | 1.000 |