 3
3peptides
spectra
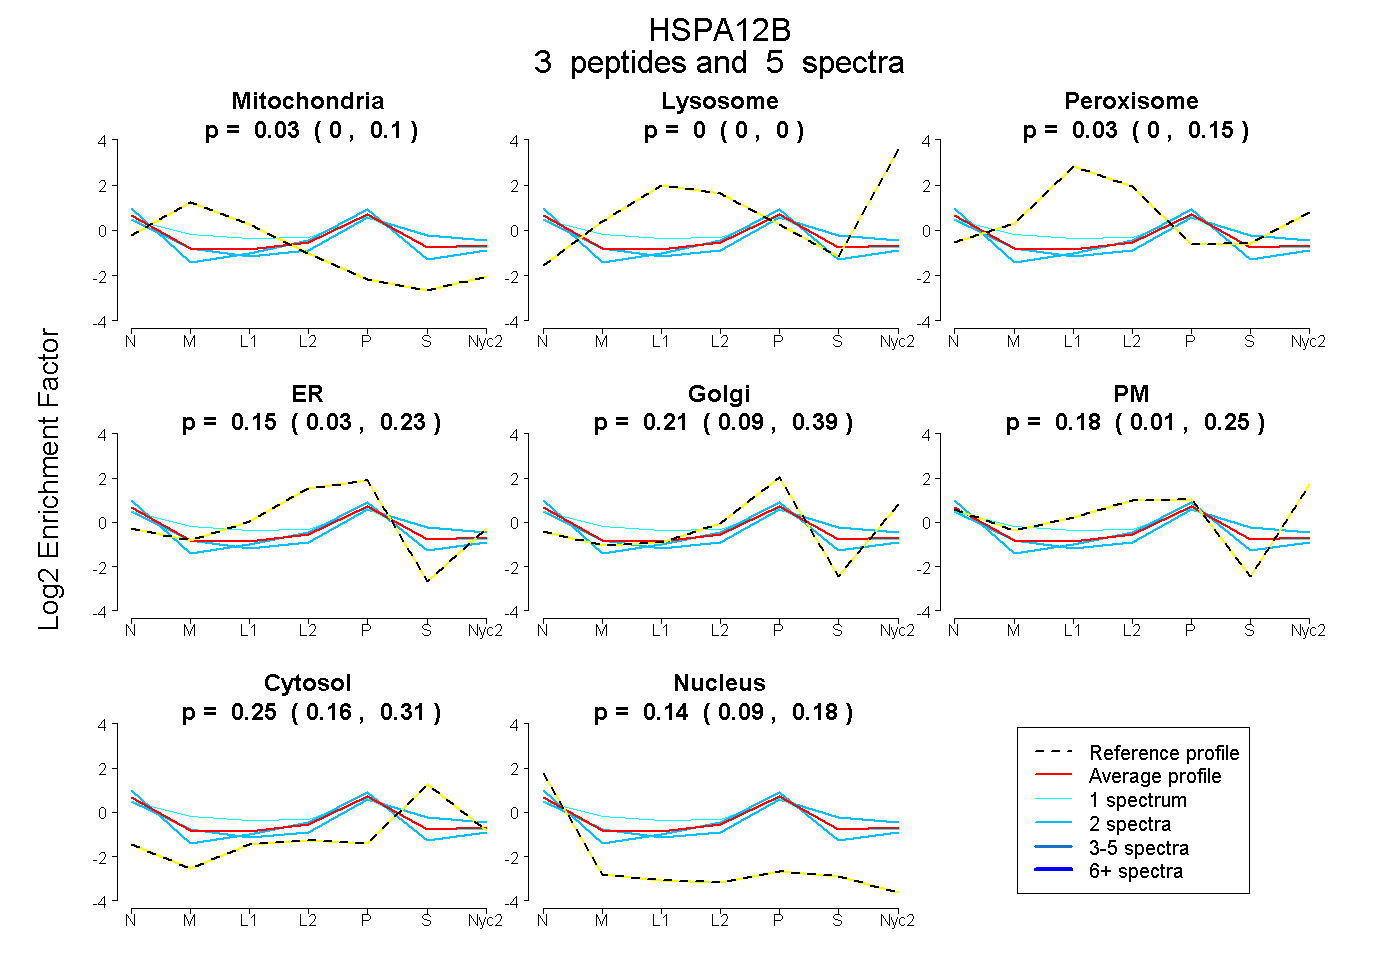
0.000 | 0.100
0.000 | 0.000
0.000 | 0.150
0.026 | 0.233
0.088 | 0.391
0.014 | 0.254
0.163 | 0.307
0.085 | 0.183
1peptide
spectra
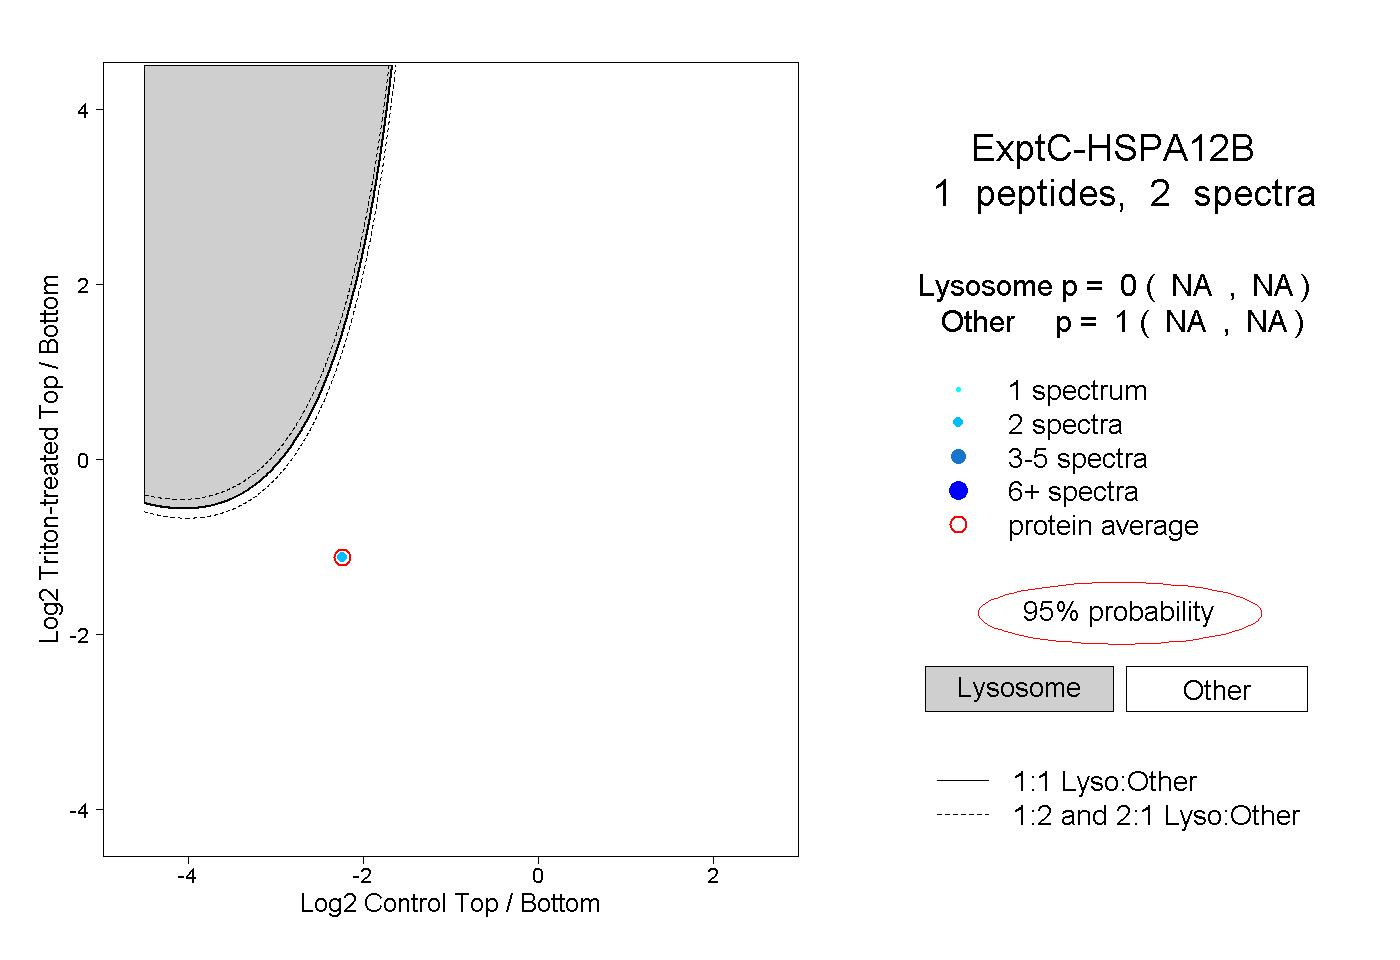
NA | NA
NA | NA
| Plot | Mito | Lyso | Perox | ER | Golgi | PM | Cytosol | Nucleus | |||||
| Expt A |
3 peptides |
5 spectra |
|
0.035 0.000 | 0.100 |
0.000 0.000 | 0.000 |
0.032 0.000 | 0.150 |
0.151 0.026 | 0.233 |
0.213 0.088 | 0.391 |
0.179 0.014 | 0.254 |
0.254 0.163 | 0.307 |
0.136 0.085 | 0.183 |
||
| Plot | Lyso | Other | |||||||||||
| Expt C |
1 peptide |
2 spectra |
|
0.000 NA | NA |
1.000 NA | NA |